|
APPENDIX
No:
2 - Managing
bushfire risks now and into the future |
|
Item
No:
GB.2 |
Managing Bushfire Risk, Now
and into the Future
|
APPENDIX
No:
2 - Managing
bushfire risks now and into the future |
|
Item
No:
GB.2 |
Managing Bushfire Risk, Now
and into the Future
Ku-ring-gai Principal
LEP Draft Background
Study February 2011 Ku-ring-gai
Council
|
Revision |
Details |
Date |
|
Public
exhibition version |
Managing Bushfire Risk, Now and into
the Future |
4
Feb 2010 |
|
|
|
|
|
|
|
|
|
|
|
|
Contents
1. Introduction
1.1....................................... Aims and Objectives
2. Legislative
and Policy Context
2.1............... Role of State Agencies and
Council
2.2................. Legislative and Policy
Framework
Environmental
Planning and Assessment Act (1979)
NSW
Local Government Act (1993)
NSW
Rural Fires Act (1997)
National
Inquiry on Bushfire Mitigation and Management (2004)
Metropolitan
Plan for Sydney 2036 (2010) and the North Subregion: Draft Subregional Strategy
(2007)
Plan
for Collaborative Action on Climate Change (2006)
NSW
Planning for Bushfire Protection (2006)
National
Climate Change Adaptation Framework (2007) 12
Hornsby–Ku-ring-gai
Bush Fire Risk Management Plan (adopted 2010)
Ku-ring-gai
Bush Fire Prone Land Map (2008)
Ku-ring-gai
Bush Fire Evacuation Risk Map (2008)
2.3. Legislative and civil liability risks to local
government
Consideration
of risks
Reasonableness
in decision making and climate change
Implications
for local government
3. Bush Fire
Behaviour and Management
Fuel
Topography
Weather
3.1................... Climate and weather
projections
3.2. Key predicted changes resulting from climate change
3.3...... Variability and uncertainty of projections
Other
influences on fire behaviour
3.4.................................... Characteristics of fire
Smoke
Radiant
heat
Direct
flame contact
Wind
3.5................................ Historic bush fire events
’76 –
’77 Fires
’79 –
’80 Fires
’90 –
’91 Fires
’91 –
’92 Fires
’93 –
’94 Fires
’01 -
’02 Fires
Fire
trends
3.6............... Future fire frequency and
intensity
Projected
changes in bushfire risk and behaviour
Estimating
probability and consequence
3.7.......................................... Fuel management
Current
fuel management
Future
fuel management
4. Vulnerability
and Resilience
4.1. Geographic and human settlement vulnerability
Geographic
and land use vulnerability
Vulnerability
by catchment
Cultural
assets
Housing
stock
Other
infrastructure
4.2. Social and demographic vulnerability and resilience
Socio-economic
characteristics
Income
and insurance
Mobility
Transport
and energy disruption
Psychological
effects
Other
impacts
4.3. Environmental and ecosystem services vulnerability
Biodiversity
Current
pressures
Dependence
on specific fire regimes
Hazard
reduction burns and Asset Protection Zones. 34
Biodiversity
corridors
Erosion
Recoverability
from bushfire
Cumulative
impacts
4.4. Current response capacity and preparedness
Brigades
Fire
trails
Water
availability
Community fire units
Hazard
reduction capacity
Response
capacity at the household level
5. Consequences
of Bushfire Events
5.1................................ Loss of life and property
5.2......................... Human health and wellbeing
5.3............................... Economic considerations
5.4...................................... Natural environment
6. Response to
Bushfire Risk
6.1............................................... Reduce Hazard
Hazard
reduction burning
Ecological
burns
Undergrounding
power poles
6.2...... Improve resilience of current community
Structure
retrofits
Community
education
Community
Fire Units
Defendable
spaces and Asset Protection Zones
Static
water supply
Bunkers
Vulnerable
Communities Unit
Retreat
and resettlement
Wildlife
protection and ecological restoration
6.3..... Reduce vulnerability of future community
Introduction
Development
restrictions
Construction
standards
Bunkers
Addressing
evacuation risk
Minimum
lot size
Minimum
lot depth
Rezoning
Lands
to which planning controls could be applied
6.4..................................... Emergency Response
Evacuation
routes
Fire
trails
Communications
New
brigade
6.5................................. Research/Measurement
6.6...................... Summary of recommendations
7. References
Appendix A
Appendix B
Appendix C
Appendix D
Appendix E
Figures
Figure 1 Location sketch of
Ku-ring-gai local government area
Figure 2: Bushfire Prone
Lands and Bushfire Evacuation Risk Map
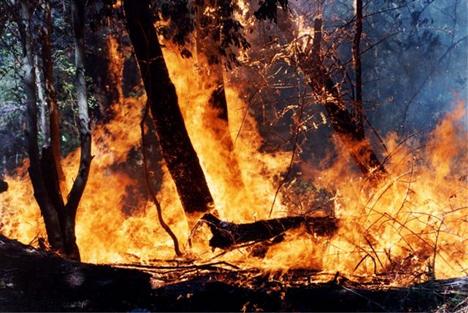
Figure 3 Under climate
change, bushfires are expected to increase in frequency and intensity.
Figure
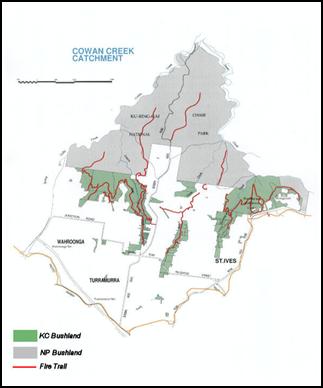
4: Bushland within the Cowan catchment
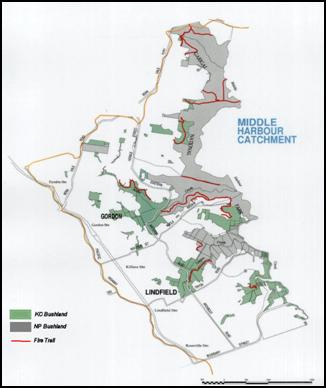
Figure
5: Bushland within the Middle Harbour Catchment
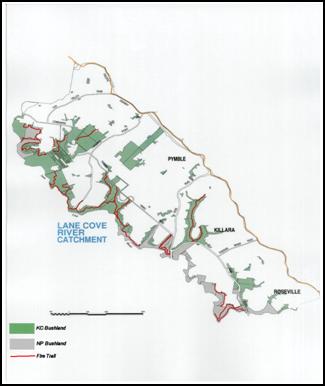
Figure
6 Bushland in the Lane Cove River catchment
Figure
7 Bush Fire Frequency Hornsby Ku-ring-gai BFMC Bushfire Risk Management Plan
2009
Figure 8 Bushfire risk rating for
Ku-ring-gai ………………….29
Figure
9: Age structure of Ku-ring-gai Council LGA
Figure
10 Fire threshold map, Hornsby-Ku-ring-gai Bush Fire Risk Management Plan 2010
Figure
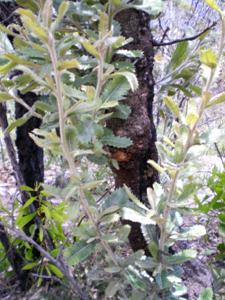
11 Some species have evolved with bushfire.
Figure
12 Location of fire agencies within the Ku-ring-gai LGA.
Figure
13 Comparison of response capability
Figure 14: Marysville Primary
School damaged by in the Victorian Black Saturday Fire, 2009. (Image Source:
AFP, William West)
Figure
15. Some of the threatened species and communities found in Ku-ring-gai that
may be further threatened by altered fire regimes
Figure 16 Number of dwellings
in the Bushfire Evacuation Risk Zones
Figure
17 Potential new fire brigade location
Figure B1 Cowan Catchment
example of ‘ideal’ setback for Asset Protection Zone
Figure B2. Middle Harbour
Catchment example of ‘ideal’ setback for Asset Protection Zone
Figure B3. Lane Cove River
Catchment example of ‘ideal’ setback for Asset Protection Zone
Figure C1 Percentage of
Ku-ring-gai population 75 years and over in relation to Bushfire Prone Land
Category 1
Figure C2 Percentage of
Ku-ring-gai population 60 to 75 years and over in relation to Bushfire Prone
Land Category 1
Tables
Table 1 Percentage increase from present in days where fire
danger is very high or extreme
Table 2 Projected increase in fire risk days
Table 3 Risk of property destruction from fire, distance to
bushland
Table 4 Neighbourhood Safer Places in Ku-ring-gai
Table 5 Housing losses by state -1939-2009
Table 6 Bushfire fatalities 1956-2007 — activity at time of
death
Table 7 Housing losses by state and fire event
Table 8 Major and significant bushfire events and cost
Table 9 Minimum Exits for Interface Communities.
Table 10 Location of evacuation
risk areas
Table 11 Recommended minimum lot
depths
Table A1 Current zoning in bushfire prone lands and bushfire
risk evacuation zones
Table D1 Ku-ring-gai’s Evacuation Risk Areas- minimum number
of exits per household
Table E1 Minimum Specifications for Asset Protection
Zones
Table E2 Recommended Minimum Lot Depths
Abbreviations
|
APZ |
Asset Protection Zone |
|
BTE |
Bureau of Transport Economics |
|
BFMC |
Bushfire Management Committee |
|
BFRMP |
Bushfire Risk Management Plan, 2010 |
|
CCAM |
Conformal Cubic Atmosphere Model |
|
CFA |
Country Fire Authority ( |
|
CO2 |
Carbon
dioxide |
|
COAG |
Council of Australian Governments |
|
CRC |
Co-operative Research Centre |
|
DCP |
Development Control Plan |
|
ENSO |
El Niño-Southern Oscillation |
|
EP&A Act |
Environmental Planning and Assessment Act 1979 |
|
ESD |
Ecologically Sustainable
Development |
|
FFDI |
|
|
GHG |
Greenhouse Gas(es) |
|
Ha |
Hectares |
|
IPCC |
International Panel on Climate
Change |
|
KLEP |
Ku-ring-gai Local Environment Plan (Town Centres) 2010 |
|
Km |
Kilometres |
|
LEP |
Local Environment Plan |
|
LGA |
Local Government Area |
|
LPMA |
Land and Property Management
Authority |
|
NPWS |
National Parks and Wildlife
Service |
|
NSP |
Neighbourhood Safer Places |
|
PBP |
Planning for Bushfire Protection 2006 |
|
ppm |
Parts per million |
|
RFS |
NSW Rural Fire Service |
|
RTA |
NSW Roads and Transport Authority |
|
SEPP |
State Environmental Planning
Policy |
|
TEC |
Threatened Ecological Community
(incorporating Endangered Ecological Communities and Critically Endangered
Ecological Communities, listed under either state or federal legislation) |
|
APPENDIX
No:
2 - Managing
bushfire risks now and into the future |
|
Item
No:
GB.2 |
Executive summary
Bushfire risk represents a clear and present danger to the Ku-ring-gai community, both now and into the future. Future risks need to be given special consideration given the potential that changes in climate may have on historical bushfire patterns.
The main purpose of this background study is to guide the preparation of the Principal Local Environmental Plan (LEP), to reduce risks from bushfire events to an acceptable level, consistent with the objectives and actions of state and regional legislation, plans and strategies, taking into account the full range of other strategies available to Council, fire agencies and the community to address these risks.
The study uses a risk management approach to assess the management of bushfire risks, now and under future climate change situations. It examines the context within which the risks occur, including the behaviour of bushfires, likely changes under climate change, the vulnerability and resilience of the Ku-ring-gai community (physically, socio-economically and environmentally) and the current response capacity in the area. The study then considers the future consequences of bushfires, recognising that historical consequences in Ku-ring-gai may not be an adequate guide when considering a changing climate.
The residents of Ku-ring-gai come from a diverse background,
are well educated and have high average incomes. However, the ability to prevent the loss and
damage of lives, property, biodiversity and the natural environment is not
merely a question of economics, community spirit or education. The extent of bushland within and adjoining
the Local Government Area (LGA) and the steep, rugged topography of the area
results in a significant risk from fire for residents, public and private
assets and the integrity of natural systems.
Most of the development close to the hazard has been
constructed without due consideration of bushfire, (ie. prior to the passing of
relevant legislation), with the bushland/urban interface extending to over 91
kilometres in length. 13,698 existing households are located within
bushfire prone lands, as identified on the Bushfire Prone Lands Map certified
by the NSW Rural Fire Service. This places Ku-ring-gai as having the highest
proportion of interface properties within the Sydney Metropolitan Area (Chen
2005).
Development has also
occurred in a number of locations where the local community is surrounded by
extensive areas of bushfire prone vegetation, often with inadequate road
networks to enable safe evacuation. Pressure to increase development in these
areas has led to increasing evacuation risk to residents and workers, including
a high number of elderly and very young residents.
According to current
climate change predictions developed by the Department of Environment,
Climate Change and Water (2008), the
Hazard reduction burning is sometimes identified in the media as a panacea for addressing bushfire risk. However, in a good year 60 out of a total of 1,100 hectares of bushland in Ku-ring-gai is burnt as part of hazard reduction. Even at this level, local fire management resources are stretched and it is well below the area requiring prescribed burning to effectively manage the risks of fire to properties in any given year (Bradstock et al 1998). It is anticipated that the gap between what is achievable and ideal with respect to hazard reduction burning will likely be exacerbated under climate changes, as the appropriate conditions for prescribed burning will be decreased.
Council has
undertaken extensive consultation with experts and the community in regard to
potential options for adaptations to bushfire risk from climate change
(Ku-ring-gai Council 2010). These adaptations consider the impacts on life,
property and the environment and include preventative as well as defensive
actions. It also recognises that adapting and responding to
climate change related bush fire risk will not be without cost.
Many measures to address bushfire risk involve the removal of
vegetation and habitat which has a negative consequence for biodiversity and
other ecological processes. Increasing
frequency and intensity of fire in the landscape may result in a permanent
alteration of the structure and composition of ecological communities within
Ku-ring-gai already exacerbated by urban fragmentation and degradation. Flora and fauna species, habitat and
communities may be lost and ecological services, will become degraded (Pitman et al 2007). Four threatened ecological
communities found in Ku-ring-gai ‘are all likely to suffer a loss of species if
subject to repeated high frequency fires’ (Ku-ring-gai Council 2006). Bushfire
risk minimisation and biodiversity protection need to be considered in an
integrated manner if we are to ensure that ecological integrity is also
protected.
While the majority of bushfire related losses occur infrequently, losses are not unprecedented in the Ku-ring-gai region. Based on historical data, major bushfires that result in loss of life and property are ‘neither cyclic nor predictable’ (Blanchi et al in CIE 2010). The majority of losses occur infrequently, but significant losses are experienced.
Following the severity of the 2009 Victorian Bushfires, there appears to be weaknesses in our understanding of bushfire risk, policies and expectations of living in bush fire prone areas. The likely increase in intensity and frequency of bushfires under climate change will further exacerbate current risks (Bushfire CRC 2009). In line with Council’s duty of care, relevant legislation and legal precedents, and taking into account the results of the Victorian Bushfire Commission (VBRC, 2010), this background study considers planning for adaptation to climate change as a key aspect of bushfire risk management.
The central role of land use planning and development controls in reducing the risk to people and property from bushfire is recognised both in state bushfire legislation, inquiries into major bushfire events and in federal and state strategies for adaptation to climate change.
The key land
use recommendations for the draft Principal LEP are to:
a. Retain the one hectare lot size for existing Residential 2(g) lands, and increase the minimum lot size for all other residential, and school lands within the 10 evacuation risk zones that do not meet the exit criteria outlined in Appendix D;
b. Apply the E3 – Environmental Management zone to sites that contain bushfire prone lands category 1 or 2 within the 10 evacuation risk zones that do not meet the exit criteria outlined in Appendix D, and within areas identified as extreme bushfire risk in the Bushfire Risk Management Plan 2010 (Hornsby and Ku-ring-gai Councils: 2010);
c. Apply the E4 – Environmental Living zone to all other sites that contain bushfire prone lands category 1 or 2, identified as extreme bushfire risk in the Bushfire Risk Management Plan 2010;
d. Apply the recommended minimum lot depth standard to sites that contain lands within 55m of Category 1 or 2 bushfire prone lands, that are located within areas of extreme bushfire risk identified in the Bushfire Risk Management Plan 2010 (Hornsby and Ku-ring-gai Councils: 2010).
|
APPENDIX No: 2 - Managing bushfire risks now and into the future |
|
Item No: GB.2 |
1. Introduction
TERREY HILLS
Ku-ring-gai Council, located in
The extent of this bushland and the steep, rugged topography of the area results in a significant fire risk for residents, public and private assets and the integrity of natural systems. While fire is an essential element for many Australian bush landscapes to ensure the viability of vegetation communities and native fauna, the frequency, intensity and timing can have adverse ecological consequences.
Bushfire events can have major impacts on the community, infrastructure, environment, and economy. Council, along with other agencies, plays a significant role in the management of bushfire risk both on public and private land, through land use planning and assessment, land management, emergency planning and education. The need to prepare Ku-ring-gai’s Principal Local Environment Plan (LEP) provides an opportunity to incorporate strategic land management approaches to bushfire management.
Ku-ring-gai Council has researched the regional influence of climate and changing weather patterns, vulnerability related to past, current and future fire events, the level of resilience of today’s community and developed adaptations options with draft priorities according to their cost benefit (Ku-ring-gai Council 2007; Taplin et al 2010; Ku-ring-gai 2010).
This background study is used to inform the draft Principal
LEP, consistent with the objectives and actions of the North Subregional
Strategy (NSW Department of Planning 2007 and the Metropolitan Plan for
A common method of dealing with irregular events such as bush fire, is through a risk management approach. Bushfire Risk Register – A Tool for Bushfire Risk Management Planning (Zhenxiang Tan et al 2006). This is based on the Australian Standard, AS4360, Risk Management, and has become the standard for managing bushfire risk throughout NSW. In response, this planning study adopts a risk management approach to assess the constraints and future planning options for bushfire management in Ku-ring-gai.
Figure 1 Location sketch of Ku-ring-gai local government area
This background study aims to guide the preparation of the
draft Ku-ring-gai Principal LEP through providing a context for the
consideration of bushfire within the draft LEP. This will be achieved through:
· An overview of the legislative, governance, biophysical, climatic, land use and socio-economic context of bushfire in Ku-ring-gai;
· A review of past, current and future data on bushfire behaviour and management;
· The identification of the vulnerability of Ku-ring-gai to risk from bushfire events;
· The identification of key resilience factors to bushfire;
· An examination of the adequacy of existing measures to address bushfire risk now and into the future;
· A review of the probability and consequences of major bushfire events for the LGA;
· The identification of actions to
reduce bushfire risk now and into the future, with a focus on options for land
use planning.
· Balance effective bushfire
management and protection of the core ecological values of Ku-ring-gai
Ku-ring-gai Council with the regional land and fire agencies have an active program to mitigate bushfire risks. This responds to Council’s legal obligations to conduct extensive bushfire risk management programs. These include operational activities such as the implementation of landuse planning and to mitigate short, medium and long term risks to property, life and the natural environment. This section outlines the legislative framework within which this planning takes place. The potential legal repercussions to Council if it fails to adequately consider the likely future impacts of climate change are also raised.
2.1. Role of State Agencies and Council
During fire events effective, recognised leadership is required to protect life, property and the environment (Gill, 2005 pp 70). The role of local government during a natural disaster such as a bushfire includes:
· Ensuring that all required local disaster planning and preparedness measures are undertaken
· Supporting an adequate local disaster response capability, including local volunteer resources
· Undertaking actions to mitigate the effects of natural disasters on local communities
· Methodically using risk assessments in land use planning to reduce hazards
· Improving public awareness and ensuring that local disaster warnings are provided
· Ensuring local resources and arrangements exist to provide disaster relief and recovery services
· Representing community interests in disaster management to other levels of government and contributing to decision-making processes
· Contributing to post-disaster assessment and analysis
· Identifying and managing bushfire hazards
· Implementing planning controls to limit development in high-risk areas
· Enforcing building standards in bushfire-prone areas
· Facilitating local fire-prevention committees
· Encouraging and supporting volunteers
· Co-ordinating local recovery after a disaster.
(Matthews 2002 pp 21)
Section 63 of the Rural Fires Act 1997 states that it is the duty of a public authority to take steps to prevent the occurrence of bush fires and to minimise the danger of the spread of a bush fire on or from, any land vested in or under its control or management. As part of this requirement, it is the responsibility of Council to keep landowners informed of policies and policy changes, such as Council’s Bushfire Management Policy 2007 (Ku-ring-gai Council 2007b).
Severe fires experienced in
2.2. Legislative and Policy Framework
A range of legislative instruments and planning protocols address bushfire protection in Ku-ring-gai. These are detailed below.
The
objects of the Environmental Planning and
Assessment Act (1979) (EP&A Act)
include the encouragement of the management, development and conservation of
natural and built resources, the orderly and economic development of land, and
ecologically sustainable development. Section 26 outlines in very broad terms
the contents of an environmental planning instrument. This study supports the
drafting of the Principal LEP for Ku-ring-gai, an environmental planning
instrument under the Act.
Section
117(2) of the Act provides that the Minister may make directions regarding
inclusions in a Planning Proposal (re-zoning).
Section 117(2) Direction No 4.4 requires compliance with the principles of Planning for Bushfire Protection 2006 or the provision of appropriate justification for non-compliance.
The Act requires councils, councillors and council employees to have regard to the principles of ecologically sustainable development in carrying out their responsibilities are included in the NSW Local Government Act (1993)
A council’s charter includes requirements to exercise leadership, to be open and responsible and to act generally in the public interest. Specific requirements include planning for the needs of children and to have regard to the long term and cumulative effects of its decisions.
Bushfire risk planning and management became a compulsory activity for all fire districts within NSW with the introduction of the NSW Rural Fires Act (1997). The Act governs fire fighting, management, prevention and development in relation to bushfire risk.
Requirements are included for actions that assist in the co-ordination of bush fire fighting, prevention, mitigation and suppression of bush and other fires in local government areas and other parts of the State constituted as rural fire districts. The Act serves to protect persons from injury or death, property from damage, and protect the environment
by having regard to the principles of ecologically sustainable development.
A bush fire safety authority is required for residential and rural residential subdivision and for development for special fire protection purposes (i.e. school, childcare, hospital) on bushfire prone land.
Each area in the State that is subject to the risk of bush fire must form a Bush Fire Management Committee (BMFC) as part of the Act. Each BFMC is represented by the many major land management agencies including local government authorities. Ku-ring-gai is part of the Hornsby Ku-ring-gai District Bushfire Management Committee. The other members of this committee include:
· Hornsby Council;
· Fire-fighting
authorities (NSW Rural Fire Service and NSW Fire Brigades);
· NSW Land and Property
Management Authority;
· NSW Department of
Energy, Climate Change and Water (National Parks & Wildlife Service
· division);
· NSW Police;
· Nature Conservation
Council;
· Aboriginal Land
Council;
· Energy Australia;
· Integral Energy;
· NSW Farmers
Association;
· Roads and Traffic
Authority;
· Sydney Water; and
· Transgrid.
The Council of Australian Governments (COAG) National Inquiry on Bushfire Mitigation and Management (Ellis et al. 2004) recommends a risk management approach as ‘the best framework for making strategic and operational decisions about bushfire mitigation and management.’ It describes three main elements of risk modification for bushfire as:
1. Planning processes that ensure that built assets are not placed in areas of high fire risk and that structures meet standards of construction that reduce their vulnerability
2. Reducing the frequency of ignitions that result from arson and carelessness
3. Managing the landscape so as to minimise the risk of damage to life and assets.
In line with the first of these elements, the report states that:
‘Land use planning,
development controls and building standards have a central role in reducing the
risk to people and property from bushfire.’
The Inquiry acknowledged that there are many constraints on achieving fuel
reduction on a large scale across the landscape. Specifically it stated:
‘Fuel-reduction burning
should not be seen as a panacea: it needs to be used to address strategic
priorities that respect the range of assets and values in a landscape and
minimise the risk to each of them.’
Metropolitan Plan for
The NSW Government requires local land use planning to be
consistent with the objectives and actions of the Metropolitan Plan for Sydney
(NSW Government 2010b). This plan provides a broad framework to facilitate and
manage the growth and development of
The North Subregion: Draft Subregional Strategy (NSW Department of Planning 2007) covers the Ku-ring-gai and Hornsby LGAs. This regional strategy translates the objectives of the Metropolitan Strategy (NSW Government 2005) and NSW State Plan (NSW Government 2010c) to more specific objectives and actions for the Hornsby-Ku-ring-gai region. It also acts as a broad framework for the long term development of the regions, guiding government investment, and linking local and state planning issues. The strategies provide details to guide the preparation of Principal LEPs.
The North Subregional Strategy (NSW Department of Planning 2007) chapter entitled Environment, Heritage and Resources is most relevant to the management of bushfire risk and natural resources with the key directions for the North subregion. The objectives include:
· To protect the natural environment of the subregion
· To protect the cultural and heritage elements of the subregion
· To manage all development sustainably.
Two broad aims relevant to bushfire risk management for the region and specific objectives and are:
1 To avoid/minimise bushfire risks to life property and biodiversity:
· E5.3.3 Develop bushfire prone land
maps and Bush Fire Risk Management Plans-
with an understanding of climate change implications for bushfire risk and in
accordance with Planning for Bushfire
Protection.
2 To respond to climate change:
· E5.1.1 Councils should consider latest information when planning for natural hazards including climate change;
· E5.3 Identify natural hazards and risk management measures related to climate change in Principal LEPs.
The Metropolitan Plan for
COAG recognised that a national response to climate change must meet the challenges of reducing greenhouse emissions and respond to the environmental, social and economic impacts that may result from climate change (COAG 2006).
The plan states that all jurisdictions need to work to reduce emissions and adapt to unavoidable climate change. Early adaptation planning must be a key focus and policies should be equitable, cost effective and have multiple benefits. The following sectors were identified as those with the most potential to benefit from early adaptation planning:
‘buildings, settlements and infrastructure,…emergency services; water supply… and natural ecosystems. There are also significant benefits in early adaptation planning for human health… The land use sector is identified as a sector that can derive particular benefit from further planning and action to reduce emissions’
The plan includes a commitment to work towards a National Adaptation Framework, which includes strategies for managing fire, protecting human health, conserving biodiversity and managing water resources.
Planning for Bushfire Protection 2006 (PBP) sets requirements for development in bushfire prone areas. Its major focus is to guide individual development proposals and is called up through section 79BA of the EP&A Act. It also includes a section on the preparation of LEPs and Development Control Plan’s (DCPs).
The plan acknowledges that inclusion of bushfire planning provisions in an LEP and DCP is the best way to achieve bushfire protection objectives. It highlights the opportunity to incorporate appropriate principles, to consider appropriate land uses on bushfire prone land and the provision of sufficient space for setbacks and access for fire fighting and evacuation. A number of planning principles for rezoning residential land in bushfire prone areas are set in the Act.
These principles relate to: land uses for special fire protection purposes; the provision of perimeter roads; asset protection zones; building lines consistent with the incorporation of an APZ; minimising the urban/bushland interface; and the location of hazardous developments and combustible materials.
Following the 2009 Victorian Bushfires, the Council of Standards Australia (Standards Australia 2009) has amended the construction requirements as detailed in AS3959-2009 (for construction on bushfire prone lands) as follows:
· Replaced three construction levels with six Bush Fire Attack Levels (BAL) based on the potential of a building to be exposed to various heat fluxes associated with ember attack, radiant heat and/or direct flame contact.
· Included more details for determining the effective slope influencing the rate of fire spread.
· Included provisions for attached structures (i.e. garages).
· Included provisions for building materials that have been subjected to fire safety test methods.
The plan also recognises that infill development may require a greater degree of performance based assessment. It is noted that significant areas of existing development do not meet bushfire protection requirements currently.
PBP requires councils to consider exempt and complying development provisions. However, this provision has been superseded by State Environmental Planning Policy (Exempt and Complying Codes) 2008, which sets state-wide controls for exempt and complying development. The first instalment of complying development standards for development on bushfire prone was recently incorporated into the SEPP.
Many principles are easier to achieve in
The National Climate
Change Adaptation Framework (COAG 2007) was developed in line with the
requirements of the Plan for Collaborative Action on Climate Change by the
Council of Australian Governments (COAG). The Framework outlines the agenda for
collaboration between governments to address the need for targeted information
and allow for the development of adaptation strategies to 2012 – 2014. Supporting decision-makers to understand and
incorporate climate change into policy and operation decisions is a key focus
of the framework. Potential areas of action incorporate the drying region of
eastern
The framework sets out a number of actions applicable to local government including:
· Analysis and revision of planning systems including standards for buildings, development and subdivisions;
· Review of information used to determine vulnerability of settlements to climate change related hazards, and development of risk management guidance to take into account any projected changes as a result of climate change;
· Identification and prioritisation of infrastructure assets vulnerable to climate change and development of risk management strategies to reduce vulnerability;
· Development of natural disaster risk reduction strategies, assistance with emergency services planning and recovery management.
Councils are required to include operational, emergency, recovery and land-use planning and policy measures in their strategies for adaptation to climate change. This applies to planning for council’s own services and property, the natural environment and the community.
The Hornsby-Ku-ring-gai Bush
Fire Risk Management Plan (BFRMP) (2010) was prepared by the Hornsby/
Ku-ring-gai Bush Fire Management Committee pursuant to the Rural Fires Act (1997) and the Australian/New Zealand Standard AS/NZS 4360: 2004 Risk Management. The Draft North Subregional Strategy also
includes a provision to consider this plan.
The plan identifies community assets that are at risk from bush fire and establishes a 5 year program of co-ordinated multi-agency treatments to reduce risk and will be reviewed after this time.
The BFRMP supports four objectives, including:
1. To reduce the number of human-induced bush fire ignitions that cause damage to life, property and the environment
2. To manage fuel to reduce the rate of spread and intensity of bush fires, while minimising environmental/ ecological impacts
3. To reduce the community’s vulnerability to bush fires by improving its preparedness
4. To effectively contain fires with a potential to cause damage to life property and the environment.
The strategies established in the BFRMP address the bushfire hazards, vulnerability of assets to fire, safety of the community and fire-fighters, and protection of the environment from fire. The plan recognises the role LEPs can play in controlling development in bushfire risk areas.
While the plan acknowledges
that climate change will increase bushfire risk, the risk assessment process
applied in the plan was based on current climatic conditions.
Council’s bushfire prone land map was certified in January 2008. The map is included at Figure 2 and classifies land according to the following fire risk categories:
· Bushfire Prone Vegetation - Category 1
· Bushfire Prone Vegetation - Category 2
· Bushfire Prone Vegetation buffer – 100m buffer to Category 1, and 30 m to Category 2.
Development of this map is a requirement of the EP&A Act where a Bush Fire Risk Management Plan applies. Council’s are required to prepare these maps after consultation with the Commissioner of the NSW Rural Fire Service..
Changes to the bush fire prone lands map occur regularly in line with changes to development and bushland structure. These amendments are required to be considered by the NSW Rural Fire Service (RFS).
This map identifies areas within the LGA where severe evacuation risks may occur during a bushfire event. The map is identified within SEPP (Housing for Seniors or People with a Disability) 2004 and SEPP 53 – Metropolitan Residential Development and limits development in accordance with these instruments. These instruments limit development for dual occupancy and seniors’ developments in these areas.
The bushfire evacuation risk map was updated and certified in January 2008 (Figure 2). New areas included in the update apply to SEPP (Housing for Seniors or People with a Disability) 2004. It is unclear whether the new areas apply to dual occupancy permitted under SEPP 53.
Council’s bushfire evacuation risk map has the potential to be used further to guide operational strategies and to consider appropriate land uses and density in these high risk areas.
|
APPENDIX
No:
2 - Managing
bushfire risks now and into the future |
|
Item
No:
GB.2 |
2.3. Legislative and civil liability risks to local government
Local governments are obliged to determine the short, medium and long term risks to their assets under their care and control. They must also forecast foreseeable changes that influence the level of risk, assess this against its reasonable financial capacity and consider the legislative and civil liability risks arising from its planning and decision-making (NSW Government 1993; NSW Government 2002).
Planning and decision-making in relation to potential future climate change and the probability and consequence of future fire events need to be incorporated within this assessment.
The lack of action to address climate change at all levels is
encouraging individuals and environmental groups to explore non-legislative
solutions. This includes taking their matters to the court system (Peel 2007).
A significant number of successful administrative challenges involving climate
change have occurred through the
The
Local
government must take into consideration the legislative and civil liability
risks arising from its planning and decision making.
There is a
significant amount of good quality, detailed and easily accessible information
available for local government authorities to use in the development of land
use plans. Scientific (IPCC 2007a;
Local government contributes to the impacts arising from climate change, and risks legal liability if it fails to:
· reduce green house gas emissions
· assist efforts to offset risks
· recognise the potential consequences of climate change
· identify risks and protect infrastructure under their care and control
· implement strategies to maximise resilience to the physical, social and economic impacts of climate change
· demonstrate the application of the precautionary principle.
The Local Government Act 1993 provides
strong support for the argument that councils should attempt to deal with the
consequences of climate change. Failure to do so may constitute a breach of its
legal obligations under the Act. This is also supported in the Civil Liability Act 2002 (NSW), ss
42-43;
‘Therefore uncertainty relating to climate change is not a valid reason
for a failure to respond to its potential impacts however these obligations
must be read in light of the recognition of resource availability and the
concept of reasonableness .’
Given
Community
consultation regarding
Ku-ring-gai
is ranked 3rd for bushfire risk in the Greater Sydney
Metropolitan Region, (behind the It has the largest number of properties
within the bushland urban interface.
‘Local governments currently have available to them a number of defences that seem likely to protect them from claims based on a failure to recognise and respond to information about climate change. Nevertheless, just as the science of climate change is gathering momentum, so too the law in this area is evolving rapidly. Local governments should therefore take care to ensure their actions, decisions and policy responses to matters that may either contribute to, or be affected by, climate change remain current and reasonable in what is a rapidly evolving policy context’ (England 2007 pp 14).
Local government may
be considered ‘easy targets’ for litigators who seek to establish a causal
connection between a Council decision or plan which allows developments in areas vulnerable to climate
change impacts, and associated damage to life or property.
To reduce litigation risks, local councils must account for the effects of climate change in asset management, land use planning, policies and development approvals. This can be achieved by adhering to the principles of Ecologically Sustainable Development, as been applied to climate change matters in NSW courts. Council must also fulfil its primary duty of care to the community.
It is feasible that
local government decisions may be subject to increasing litigation and legal
challenge on
Councils need to be
mindful of whether their policies and strategies demonstrate sufficient
precaution or foresight in the investigation and interpretation of the
likelihood of a risk occurring. This consideration also links to the magnitude
of the consequence arising from the manifestation of the risk.
Impacts such as drought, extreme heat, storms and bush fire
have occurred in
Figure 3 Under climate change, bushfires are expected to increase in frequency and intensity.
Bushfire behaviour is influenced by multiple variables
including fuel, topography and weather. These interact in ways that affect the
location, season, frequency and intensity of bushfires. The northern suburbs of
The type and
arrangement of fuel has more of an effect on fire behaviour than the quantity
of fuel (O’Bryan 2005).
The bushland surrounding Ku-ring-gai is dominated by a number of vegetation communities including Threatened Ecological Communities (TEC’s). The main vegetation groups, as defined by Specht et al (1995), include:
· Closed scrub/heath which dominates the broad ridge tops with exposures to the north;
· Low woodlands which cover the sheltered easterly facing upper to mid slope;
· Woodlands which cover the upper to mid slopes with exposed westerly aspects;
· Open forests, which run through the creek lines and lower slopes.
All these vegetation communities generate high levels of fuel
capable of supporting a bushfire.
Fire is most intense
when it burns from the ground layers up into the canopy. For fire to rise up
into the canopy it requires a fuel ladder. The first rung of a fuel ladder
begins with fine fuels, such as leaf litter and fine twigs. Under extreme
bushfire weather, these fine fuels ignite very readily, and can be ignited by
wind borne embers from other fires. Fine fuels are usually intermingled with
the next rung of the fuel ladder of near surface fuels, such as tufted grasses
and low shrubs. This elevates the fire to the next rung of taller shrubs and
small trees, then elevating the fire into the canopy. Once in the canopy, fire
can spread through the interconnected canopy whilst supported by ground fuel.
Fire can move rapidly into the canopy increasing intensity and accelerating
spread. Spotting over longer distances is achieved during high wind when the
fire reaches the canopy. Such fires are much more difficult to manage, as
evidenced by the tragic results of the Victorian bushfires of 2009 (VBRC 2010).
Most of the 11km2 of surrounding bushland is
contiguous with larger areas to the north, south-west and east.
approximately 15,000 ha
Approximately half of
the 54,000 ha of bushland in the
Ku-ring-gai and Hornsby region is composed of vegetation that will support and
sustain high intensity fires into the canopy. This presents local and regional
risks to private and public assets and the environment.
Extreme bushfire
weather, the type and arrangement of fuel, and the deeply incised nature of the
topography surrounding Ku-ring-gai contribute to the high bushfire risk in the
area.
Topography influences wind speed and direction, rate of spread of fire, spotting activity and flame length and depth. All of these factors increase commensurate with an increase in slope gradient (O’Bryan 2005).
There are three major catchments that make up the Ku-ring-gai
LGA, Cowan,

Cowan
catchment
Cowan catchment (Figure 4), comprises 70 per cent bushland
most of which is
Figure 4: Bushland within the Cowan catchment
 St Ives Chase is a relatively
narrow valley running north north-east to south south-west. It dissects two
broad ridgelines and supports Branch of Cowan Creek. This narrow valley extends
to the north to include
St Ives Chase is a relatively
narrow valley running north north-east to south south-west. It dissects two
broad ridgelines and supports Branch of Cowan Creek. This narrow valley extends
to the north to include
The area between St Ives Chase and the St Ives Showground is a large open area divided by valleys and slopes. There are
more ridgelines than in other sub-catchments but they are not as broad. The valleys are generally deeply incised between the broad ridgelines and link to ‘fingers’ of bushland that extend the bushland/urban interface to over 91 kilometres[1] throughout the LGA. While the valleys provide vectors for the spread of bushfire, there are a number of ‘peninsulas’ of urban development between these valleys.
Middle Harbour Catchment (Figure 5) is comprised of
discontinuous areas of Council managed bushland interspersed between sections
of
The
For the most part, the area faces the east. The area extends
from Mona Vale Road St Ives in the north, to
Figure 5: Bushland within the
Rising from the
Figure 6 Bushland in the
Weather is the most
powerful and immediate influence on fire behaviour.
The Australian climate is typically associated with an eastward-moving sub-tropical high pressure belt associated with Hadley atmospheric circulation. The sub-tropical high pressure belt migrates north in winter and south in summer causing seasonality of rainfall in the north and south of the continent. Hot, dry air descends in the high pressure system, and has resulted in arid conditions over most of the continent (Sturnam and Tapper 2005)
The migrating sub-tropical high pressure belt and the
inter-tropical convergence zone (ITCZ) influence the seasonality of rainfall
over
These weather conditions are further exacerbated by the El
Niño–Southern Oscillation (ENSO) phenomenon. ENSO has three phases, namely
above average rainfall (La Niña), below average rainfall (El Niño)
and a neutral phase where conditions oscillate between the two. La Nina
conditions in
The median annual rainfall for the Ku-ring-gai area is approximately 1200mm. On average, the highest rainfall occurs in March and lowest in January (DPWS/MHL 1998). Evaporation rates exceed precipitation during the period from October to January in the region.
Extreme bushfire
weather that coincides with a Forest Fire Danger Index (FFDI) in excess of 50
is usually associated with long periods of drought and little recent rainfall
(Hennessey et al, 2007). Extreme fire danger days coincide with low
precipitation, high evaporation rates, strong north-westerly (hot, dry and
gusting) winds, high temperatures, low humidity and prolonged periods of
drought.
Wind speed can also
affect fire travel. Wind direction may vary, with the worst scenario seeing
winds from the north-west, typically. hotter winds warmed from the desert which
historically occur between August and November. Ku-ring-gai can experience
these extreme conditions, particularly during the transition from winter to
summer. North-easterly and south-easterly winds prevail during summer, but wind
direct can make dramatic changes in the late afternoon or overnight.
These weather
patterns have historically resulted in the NSW bushfire danger period being
between the beginning of October and the end of March. Prime bushfire
conditions reach the
The hazard reduction
season within NSW extends from April to the end of September. Within the
However, under El
Niño conditions, droughts are experienced and the traditional bushfire danger
period in NSW is changed. This often seriously hampers fuel management programs
as the usual benign conditions that are good for low intensity controlled burns
make hazard reductions dangerous.
Approximately
half of the 58,400 ha of bushland in the Hornsby–Ku-ring-gai region is
composed of vegetation that will support and sustain fire into the canopy,
resulting in high intensity fires.
3.1.
Climate and weather projections
The government agencies of NSW and the
There is a range of effects cited in the modelling from relatively minor changes to catastrophic. This variation is dependant on both global and local actions to reduce CO2 emissions, If CO2 emissions are controlled to less than 500ppm then there is a stronger possibility that the magnitude of change will be low (DECCW 2010). However if carbon emissions are not reduced then there is strong possibility that the catastrophic effects will arise. Due to the current failure of international cooperation on climate change, it appears that the potential for high emission scenarios will need to be considered in any adaptation strategy.
3.2. Key predicted changes resulting from climate change
Under climate change, weather patterns are set to change. It
is predicted that temperatures will rise and that rainfall patterns will alter
with the wetter period now expected to occur in winter and decline over summer.
Relative humidity is also predicted to decline and wind speed and direction
will remain relatively unchanged although its frequency and intensity may
increase. In short,
The pattern of the El Niño-Southern Oscillation cycle is projected to continue but with higher temperatures than currently experienced. El Niño years are likely to continue to be drier than average and become hotter. La Niña years are likely to become hotter and wetter than average, and storms with heavy downpours are projected to be more frequent.
In El Niño events, water stress is projected to be more intense due to higher temperatures.
Therefore, while the climate is changing, the unfavourable conditions brought on by ENSO will become more intense. Droughts occurring under El Niño are set to become more prolonged with heat waves and days of extreme temperatures and low relative humidity increasing.
While most climate models predict that rainfall will reduce as a result of climate change a few models predict a modest increase of between 1 and 10%. But even with this potential increase when evapo-transpiration is accounted for, all models predict a net decline in available water. This has ramifications for bushfire fighting and for hazard reduction burning, especially at the urban/bushland interface.
In summary, the downscaling of global predictions to the Sydney region predict: significantly increased spring and summer rainfall; decreases in winter rainfall,, higher maximum temperatures; changing runoff patterns with greater runoff in summer and autumn; Increased heatwaves; prolonged droughts; and reduced water availability. In terms of bushfires, this will result in a longer fire season with increased frequency of very high or extreme fire-risk days and increased fire frequency and intensity.
3.3. Variability and uncertainty of projections
The majority of the climate change data used in this study is based on the CSIRO study (Hennessy et al. 2005).
The smaller scale modelling used by Hennessy et al often requires an increase in complexity to reflect actual ground conditions in a specific geographic location. This often results in models having greater degree of error.
Increased
risk from bushfire has been identified as the single most serious threat to
Ku-ring-gai from climate change. (Ku-ring-gai Council: 2010a)
Land management, fire
suppression and fire ignition, are other factors that play an important role in
bushfires Humans have the capacity to influence fire regimes particularly as
the majority of fires are ignited by people (including hazard reduction burns).
It could be argued that, as population increases, there may be more arson
causing bushfires, for the purposes of this report, however, it is assumed that
human involvement would remain at constant levels into the future.
Australian bushfires
start with a thin front of flames. These flames are usually as thick as they
are high. Typically, forest fires have speeds between 1 to 3 km/h, have flames
between 10 and 20 metres high and thick, and will go past a spot in 30 seconds.
They have been known to travel up to 12 km/h, with flames between 100 and l50
metres high and thick (Bureau of Meteorology 2007d).
Ember attack
Loose bark, twigs,
leaves and small debris are carried up by air and transported by winds to potentially
ignite more combustible fuel. If sustained long enough, this ignition will
start new “spot” fires ahead of the main fire front. Stronger winds and
convected air columns can result in lit debris (embers) being carried further
ahead of the main fire front. Such spotting is a characteristic of bushfire
behaviour, particularly forest fires as forests provide the elevated fuel
characteristics that encourage spotting.
Ember attack has been
identified as the main cause of house ignition during and after a bushfire
incident (Leonard et al, 2004). Embers thrown can attack a house for up to 30
minutes prior to the arrival of the bushfire front, when the fire front is 400
to 500 metres from the house. This can continue for many hours after the fire
front has passed.
Embers attack houses
by lodging in roof cavities, eaves, and gutters, under houses, weep holes in
brick work, window sills and entering houses through fractured windows. Any
object that interrupts the flow of air will stop embers and cause them to build
up potentially forming a source of ignition.
Urban landscaping,
street trees parks and urban reserves can be ignited by windborne embers and
carry a bushfire into developed areas placing the community at great risk. This
can occur regardless of Asset Protection Zones or any other fire mitigation
measures adopted.
Ahern et al (1999) studied three extreme
wildfire events (pre
This example is
useful to a point, but is limited by the fact that it only examined distance
from the hazard, but did not consider other risk factors such as:
· The construction and design of the house or its vulnerability,
· Whether the house was destroyed during the passage of the fire or at some time later;
· Whether the house and garden were properly maintained and prepared for the onset of a bushfire;
· Whether an able-bodied person was at home at the time;
· Whether those houses that were destroyed at greater distances from the hazard were destroyed by embers emanating from the bushland boundary or some other source.
Bushfires generate
large amounts of smoke. Fire smoke can produce direct physical effects on
people, especially in those with respiratory illnesses such as asthma and
emphysema, as well as psychological effects. Stress and anxiety levels in many
people can be raised simply by the smell of smoke in the air. Smoke can also
reduce visibility to the extent that roads and even airports need to be closed
temporarily (Granger,
et al. 2001as frequently occurs on the
F3 freeway.
Bush fires generate
extreme heat levels at their active front. As the fire travels forward, the
extreme heat lasts for only a few minutes, however, it is sufficient to fracture
glass or cause combustible items inside a building such as fabric and paper to
burst into flame. Radiant heat is also a significant threat to heat-sensitive
power supply and other electronic equipment (Granger, et al. 2001).
Flame impingement of
the structure can occur through either direct flame contact from the main fire
front or by smaller localised flame impingement from localised fuel sources
(vegetation, sheds, fences). Either way the external structure elements may ignite
or the flames may act on the envelope until an aspect of it opens up to allow
ignition of building contents (Wang 2006).
Exposure to flames is
typically only a threat where vegetation or other fuel is allowed to accumulate
under, against, or on the exposed building, or where the material of the
structure is also flammable (ie timber decks).
Wind speeds in excess
of 120kmh can be experienced in fires due to convective forces generated from
the fire itself. This is somewhat greater than the wind loading standard
applicable to most urban buildings. Such wind can cause direct damage, through
unroofing buildings, impact damage from propelling debris, including burning
debris (Granger, et al.
2001).
3.5. Historic bush fire events
In the past,
bushfires have caused great property damage and loss in
According to the NSW
RFS (2008), six fires were recorded since 1976 that have affected the
Ku-ring-gai and/or the surrounding area. Detailed information on losses has
only been reported for the major fires, including the fires of 1994, and 2002
to a lesser extent.
The fires of 1976-77 affected
the Hornsby and
The fires of 1979-80
in the Warringah area were associated with severe drought conditions over much
of the state. In the Warringah area alone, 9,000 ha of bush was burnt and 14
houses were lost. According to the data, fires burned over the majority of
council areas in the state. One life was lost in this fire season in the Mudgee
area.
The fires of 1990-91
were noted to have affected many of the council area in northern
The fires of 1991-92
impacted Kenthurst in the Baulkham Hills shire, where 2 people died. This
occurred early in the dangerous period of the fire season, in October. Fires
also affected the
The fires of 1993-94
had the largest impact on the Ku-ring-gai area, as well as most of the state.
Across the state, 206 homes were destroyed and 4 people died. Extensive
inquiries into these fires details the losses associated, including losses in
the Ku-ring-gai area. The Ku-ring-gai fires occurred in the
The local impacts of
the fires of 2001-02 were centred mainly in the Ku-ring-gai area, mainly in the
From this history,
there are usually one or two bush fires that impact Ku-ring-gai or the
surrounding area every ten years. The Hornsby/Ku-ring-gai Bush Fire Risk
Management Plan (BFRMP) documents that large scale and intense wildfires occur
once every 10 years. An excerpt from the fire frequency map is included at
Figure 7. Large scale and intense fires are associated mainly with El Niño
conditions and post La Niña conditions (Lucas 2005).
The last 70 years has
been characterised by unusual and extreme ENSO conditions, where 30% of the
extreme ENSO conditions that have occurred since the 1500’s have occurred since
1940, with a strong bias towards enhanced El Niño conditions (Gergis and
Fowler, 2006). Since fire weather is strongly associated with the ENSO phenomenon,
predicting frequency of fire weather in
Further, Lucas et al
(2007 in Tapner et al. 2010) have found that there has been a general increase
in the Forest Fire Danger Index (FFDI) between 1973 and 2007.
Two thirds of the 173
people who died in the Victorian Bushfires were trying to defend well-prepared
houses (VBRC, 2010). The Victorian Bushfire Commission’s review noted that
direct flame attack appeared to be more prevalent than in previous bushfires
and that this high incidence is considered to have resulted in the high number
of deaths (VBRC, 2009b cited in ABCB, 2010a).
It has been noted that the fires exposed weaknesses in our understanding
of bushfire risk and in the policies and expectations for bush fire prone areas
(Bushfire CRC in Fire
 Australia 2010).
Figure 7 Bush Fire Frequency Hornsby Ku-ring-gai BFMC Bushfire Risk
Management Plan 2009
3.6.
Future fire frequency and intensity
As described in the
section on climate change, projections for the Sydney region include
significantly increased spring and summer rainfall while winter rainfall
decreases, higher maximum temperatures and evaporation rates, changing runoff patterns
with greater runoff in summer and autumn and increased severity and frequency
of heatwaves and droughts.
Such changes are
likely to result in significant changes to historical bushfire regimes and will
impact on the success of current bushfire management planning and techniques.
A number of studies relating to the impacts of climate change
on bushfire risk in
The historical record for bushfire weather in
According to Hennessy et al (2007) (in Parry et al. eds 2007), heatwaves and fires are virtually certain for Australia, and will result in an increase in fire danger associated with increased frequency and intensity, decreased fire extinguishments and faster fire spread. The projected future changes in climate will result in a longer fire season with increased frequency of very high or extreme fire-risk days and increased fire frequency and intensity.
Increased risk is largely due to alterations in temperature
and relative humidity. By 2100 the low emissions scenario further increases the
fire risk (above 2050) by ~25% while the high emissions case has increases in
fire risk of 50–100% along the NSW coast.
Williams and Karoly (1999) looked at how the El Niño-Southern
Oscillation (ENSO) can alter bushfire regimes. They concluded that there was a
‘coherent’ pattern of increased fire risk in south-eastern
It is projected that Ku-ring-gai will experience bushfires
starting earlier, lasting longer which include more days of extreme fire
weather. Hennessy et al eds, (2007) have predicted that very high and extreme fire
danger days are to increase in south-eastern
By 2050, Hennessy et al (2007) predict the Sydney area will
see the days it experiences over 35ºC rise from two days to four. More recent
work by the CRC (2009 in CIE 2010) shows a trend for
The study by Hennessy et al. (2005) using two simulation models (Conformal Cubic Atmosphere Model (CCAM) v2 and CCAM v3) found the following percentage increases in fire danger for the Sydney area applying both models to the Forest Fire Danger Index (FFDI) ratings; shown below in Table 1.
Table 1 Percentage increase from present in days
where fire danger is very high or extreme
|
CCAM v2 |
|
|||
|
|
% increase 2020 |
% increase 2050 |
||
|
Scenario |
Low |
High |
Low |
High |
|
FFDI |
5.75% |
12.64% |
12.64% |
35.63% |
|
|
||||
|
CCAM v3 |
|
|
|
|
|
|
% increase 2020 |
% increase 2050 |
||
|
Scenario |
Low |
High |
Low |
High |
|
FFDI |
9.20% |
27.59% |
29.89% |
74.71% |
Taplin et al (2010)
using CCAM3 from Lucas et al. (2007)
identify the likely increase in the number of days of extreme bushfire risk for
Ku-ring-gai (Table 2). Base data is available for a limited range of sites.
Richmond Air Force base data is used as a surrogate for Ku-ring-gai because it
is almost as close as
Canberra 2003 The fires were naturally lit by lightning strikes and were
driven by westerly winds into The events and the level of damage were attributed to the
drought conditions drying out vegetation, thunderstorm activity igniting
the fires, and extreme fire conditions after ignition that caused the fire
to spread.
Table 2 Projected increase in fire risk days
Ku-ring-gai environs projected increases in the
number of days/annum with very high, extreme, very extreme and catastrophic
fire weather using Lucas et al. (2007) CAM3 simulation models
|
|
Present days/pa |
2013 (0.4oC) days/pa |
2034 (1.0 oC) days/pa |
2067 (2.9 oC) days/pa |
|
|
|
|
|
|
|
Very high |
13.3 |
14.2 |
16.3 |
23.6 |
|
Extreme |
1.5 |
1.6 |
1.9 |
4.0 |
|
Very Extreme |
0.4 |
0.4 |
0.5 |
0.9 |
|
Catastrophic |
0.0 |
0.0 |
0.0 |
0.2 |
|
|
|
|
|
|
|
|
|
|
|
|
|
Very high |
7.6 |
8.1 |
9.4 |
14.2 |
|
Extreme |
1.2 |
1.4 |
1.7 |
3.5 |
|
Very Extreme |
0.2 |
0.2 |
0.3 |
1.0 |
|
Catastrophic |
0.0 |
0.0 |
0.0 |
0.2 |
|
|
|
|
|
|
|
Williamtown
(N’tle ap) |
|
|
|
|
|
Very high |
10.3 |
11.2 |
12.8 |
17.8 |
|
Extreme |
1.4 |
1.7 |
2.3 |
4.1 |
|
Very Extreme |
0.2 |
0.3 |
0.5 |
1.1 |
|
Catastrophic |
0.0 |
0.1 |
0.1 |
0.3 |
|
|
|
|
|
|
|
Nowra ( |
|
|
|
|
|
Very high |
8.8 |
9.1 |
10.3 |
14.7 |
|
Extreme |
1.1 |
1.2 |
1.6 |
4.0 |
|
Very Extreme |
0.1 |
0.1 |
0.2 |
0.6 |
|
Catastrophic |
0.1 |
0.1 |
0.1 |
0.1 |
As well as climate change altering weather patterns to increase bushfires, the additional CO2 in the air and higher temperatures may encourage bush growth, increasing fuel for a fire (CSIRO 2006).
Climate change may also adversely impact the amount of suitable days for prescribed burning as a form of adaptation. These impacts then contribute to a loop in increasing the degree of bushfire risk.
Estimating probability and consequence
The evidence strongly
suggests that climate change will increase the probability of fire and to a
lesser extent, the magnitude and severity of these fires.
Whilst the average
probability of a bushfire event endangering a single life or house in
Estimating the
probability of a change in fire incidence and magnitude is complex and relies
on the accuracy of regional data to determine changes in fire weather.
Bushfires are included in Garnaut’s (2008a) analysis of the costs of climate
change as one of nine types of ‘extreme weather events’.[3] It is
worth noting that this analysis occurred prior to the Victorian Black Saturday
bushfires and as such are likely to underestimate the consequences of wildfire.
Garnaut (2008) found that fire risk along the NSW coast would increase by 50 to
100% under a high emissions scenario and that bushfire risk would increase with
rising levels of atmospheric CO2.
There
are usually one or two bush fires that impact Ku-ring-gai or the
surrounding area every ten years
Trends to date
suggest climate effects in the more extreme end of the range of impacts, which
will remain unaltered unless rapid and decisive action is taken to reduce CO2 emissions.
 The fuel management committee of the BFMC prepares fuel management
plans for the associated land managers and fire agencies. In a good burn year, 60
ha will have received hazard reduction burns (which are sometimes referred to
as controlled or prescribed burns). This equates to slightly more than 5% of Ku-ring-gai’s
total bushland under management. This percentage aligns with figures identified
by Bradstock et al (2008) for levels
of fuel management currently generally carried out by land managers.
The fuel management committee of the BFMC prepares fuel management
plans for the associated land managers and fire agencies. In a good burn year, 60
ha will have received hazard reduction burns (which are sometimes referred to
as controlled or prescribed burns). This equates to slightly more than 5% of Ku-ring-gai’s
total bushland under management. This percentage aligns with figures identified
by Bradstock et al (2008) for levels
of fuel management currently generally carried out by land managers.
In
addition to this, many sites where development has been approved under Planning for Bushfire Protection 2006,
have areas designated as Asset Protection Zones. Landowners are required, by
condition of consent, to manage these areas to minimise fire risk. However, it
is unknown to what extent this management regime is maintained.
Future fuel management
The changing climate
will hamper the hazard reduction burn season particularly for the
However, with climate
changing and climate shift set to exacerbate that change, hazard reduction
burning may decline. The traditional burn season for the
|
APPENDIX No: 2 - Managing bushfire risks now and into the future |
|
Item No: GB.2 |
4. Vulnerability and Resilience
Vulnerability and
resilience are closely related. Vulnerability focuses on
Understanding
vulnerability and resilience requires a thorough understanding of the features
of the local community, including the community’s values and their vision for
the future of their community. This allows for
Critical factors that
affect the assessment of vulnerability and resilience are:
· Geographic and land use vulnerability
· Social and economic resilience
· Environmental and ecosystem risks
· Existing response capacity and preparedness
Identification of vulnerability and resilience factors for
Ku-ring-gai is based on a literature review, the experience of Council,
historical records of extreme events and advice from local and regional
community experts. For the purposes of this report, vulnerability and
resilience factors are based on current wea
4.1. Geographic and human settlement vulnerability
Ku-ring-gai, with National Parks on three sides and significant bushland (both in public and private ownership) along creeks and ‘fingers’ that reach in towards the main ridgeline traversing the local government area between Thornleigh and Chatswood, is extremely vulnerable to bushfire.
Early development in Ku-ring-gai occurred along the plateau
surrounding the
Clearly, properties at the interface between urban
areas and bushland are most at risk. Table 3 outlines the risk rating based on
the distance to bushland. With the bushland/urban interface extending over 91
km, Chen (2005) has determined that Ku-ring-gai has 36% of property within the
high bushfire risk area, (within 130m of the bushland interface). Accordingly
it is ranked third for fire risk in the Greater Sydney Region behind the
Table
3 Risk of property destruction from fire,
distance to bushland (McAneney, et al 2009)
|
Risk rating |
Distance to extensive bushland |
Proportion of capital city houses |
|
Very high |
Less than 100m |
6.0% or 486,000 |
|
High |
Between 100-200m |
3.2% or 259,000 |
|
Medium |
Between 200-400m |
5.0% or 405,000 |
|
Low |
Between 400-700m |
6.1% or 494,000 |
|
Negligible |
More than 700m |
79.7% or 6,456,000 |
Approximately 13,698
existing households are within these bushfire prone areas. These areas of high
bushfire risk are illustrated on the Bushfire Risk Map (Figure 2). These areas
contain residences which are typically low to medium density, brick and tile
dwellings, but also include schools and aged care facilities located on the
interface completely surrounded by bushland with just one road linking the
community to safe areas. The intrusion
of bushfire risks right into the heart of Ku-ring-gai, can be seen in the range
of specific DCP design controls to address these risks, for a mixed use site in
Turramurra centre, adjacent to Granny Springs, a bushland reserve.
With deeply incised valleys between urban development situated predominantly on the ridges and with the smaller ridges extending from the central spine into the national parks, adds to this vulnerability. The nature of the vegetation that allow the build up of dry litter exacerbate this vulnerability. Historically, there was inadequate consideration given to bushfires in the development and building control process until the enactment of the NSW Rural Fires Act in 1997 and Planning for Bushfire Protection 2001. Accordingly many properties were developed in bushfire risk areas without consideration of the risks in their design or location.
The Bushfire Risk Management Plan (Hornsby–Ku-ring-gai 2010)
(BFRMP) identifies properties with the
greatest risk to be those situated atop steep bushland slopes with northerly to
westerly aspects. Examples include the residential areas in St Ives, North
Wahroonga and
Bradstock et al (1998) identified that properties
located on a western aspect are more susceptible to fire in the northern
The bushfire risk rating map at Figure 8 is based on
the risk map in the BFRMP. The Plan determines
priority areas for risk management according to their relative vulnerability
by:
· Estimating the level of bushfire risk by using vegetation, slope and likely weather conditions;
· Identifying assets under threat by estimating the location of human settlement, community, economic and ecological and cultural assets relative to bush fire hazards
· Assessing the assets’ ability to withstand and recover from expected threats;
· Rating the consequence of bushfire.
Identified areas are rated through 5 categories from extreme risk through to low risk.

The Hornsby/Ku-ring-gai Bushfire Risk Management Plan
(2010) (BFRMP) classifies approximately 20% of the interface area within the
district as having a high bush fire hazard, and 49% having an extreme bush fire
hazard. Extreme and High bush fire hazards are predominantly in bushland areas
managed by a number of land management agencies, such as the Department of
Lands, Department of Environment, Climate Change and Water, Councils, etc. A
further 12% of the district is classified as a moderate bush fire hazard, and
8% as low bush fire hazard.
Population pressure
and urban consolidation policies are increasing population densities. While the
main focus is on areas with access to services, opportunities for increased
density in more bushfire exposed areas are still sought, and constructed,
albeit at a lower residential density than centres. There is pressure in
Ku-ring-gai, from time to time, to further develop areas that are exposed to
risk from bushfire. Examples include applications for subdivisions, interest in
rezoning larger lots in
It is noted that, of the four areas which experienced the greatest population growth within the LGA between 2001 and 2006 (SGS 2008), two are within areas subject to bushfire risk (either bushfire prone land, or land within the area of Bushfire Risk Evacuation Map, or both).
The following section
discusses the relationship between bushfire risk and the biophysical and land
use characteristics of the 3 catchments in Ku-ring-gai. Appendix A provides
more detail on the zonings by suburbs within bushfire prone lands and bushfire
risk evacuation zones.
Cowan
Catchment
A number of
institutions in this area are vulnerable to bushfire, including childcare centres
and a hospital, aged care facilities and schools. Development occurs predominantly at the top
of the catchment on the plateau to the south.
Development in the north remains sparse due to the topographical
constraints of this region.
The steep slopes of
the valleys that carry Fraser and
The slopes in the
narrow
Between St Ives Chase and the St Ives Showground, bushfires
under extreme conditions, display behavioural characteristics which see fire
spot from ridge top to ridge top with
the intervening valleys left to follow. The topography within this catchment
facilitates this bushfire characteristic. Council assets such as the
The topography of the
Cowan catchment increases risk to residents of the area. The deeply incised
valleys which separate the broad ridgelines have the capacity to carry a
bushfire escaping out of
While Planning for Bushfire Protection (both 2001 and 2006) (PBP) provide for setbacks from the bushfire hazard to the dwelling, to allow the setbacks to be used as asset protection zones, the subdivision pattern and most of the development has been established prior to this legislation. The separation distances in PBP are governed by climate, vegetation type and slope angle, and the confluence of these three variables determine the setback distances. The legislation recognises that such setbacks cannot always be achieved in infill development, so there are large areas of development in locations that are highly vulnerable to bushfire.
Figure 8 Bushfire risk rating for Ku-ring-gai from Hornsby Ku-ring-gai Bushfire Risk
Management Plan 2010, and Bushfire Evacuation Risk Zones under SEPP (Housing
for Seniors or People with a Disability) 2004.
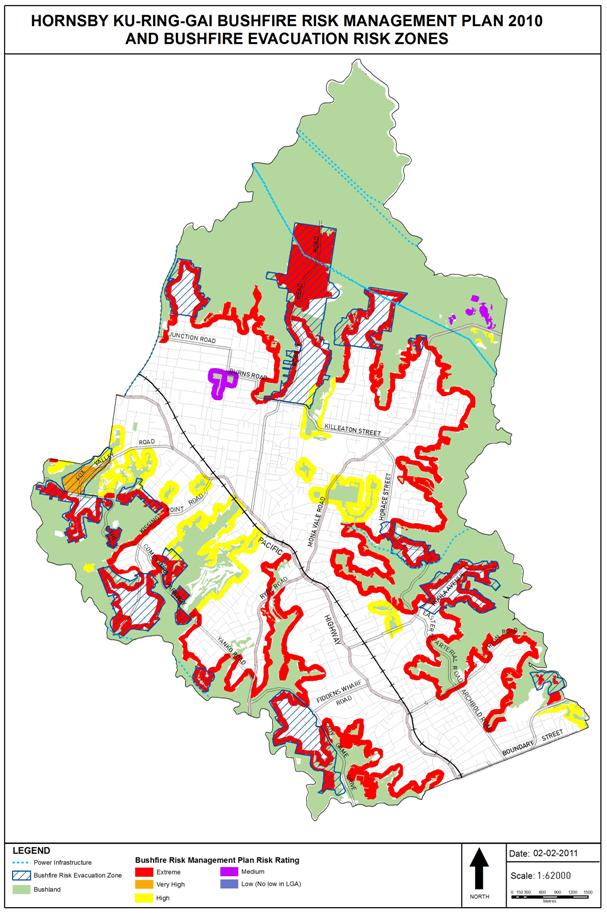
|
APPENDIX
No:
2 - Managing
bushfire risks now and into the future |
|
Item
No:
GB.2 |
Council has estimated
the setback line required to provide the asset protection zones (APZs) for a
selection of bushfire prone lands within the LGA (see Appendix B). The setback
line is calculated using the above variables as required by PBP, as if these
areas were not infill development. The resultant maps provide an image of the
extent of the vulnerability of the residents and other users in these areas. As
can be seen from Figure B1 in Appendix B, in this area of the catchment:
· No development meets the ‘ideal’ APZ requirements;
· In many cases the APZ setback line is beyond the entire property;
· In some cases the APZ setback line is beyond two or three properties.
While the valleys
provide vectors for the spread of bushfire, ‘peninsulas’ of land containing
urban development have been classified by the NSW Rural Fire Service (RFS) as
Bushfire Evacuation Risk areas[4].
The first area to be considered was the
Bushfire risk
evacuation areas have also been declared in
The steep gullies of
Hawkesbury Sandstone lead up to broad ridge lines, which are extensively
developed along the bushland/residential interface. Hawkesbury Sandstone
vegetation communities include many species that have evolved together with
bushfire, burn easily and are dependent on certain fire regimes. Council’s Bush
Fire Management Policy (2008) includes information on fire regimes for the different plant
associations within our LGA.
The Middle Harbour Catchment supports a variety of uses besides the predominant single dwelling residential development including sports fields and golf courses which give separation from the bushfire hazard. However, there is still an extensive bushland/residential interface.
The area has quite a
broad exposure to the threat of fire along the broad eastern face. The steep,
heavily vegetated valleys provide vectors for the spread of fire escaping from
As can be seen from
the APZ setback line in figure B2 in Appendix B, in this area of the catchment:
· Almost no development meets the ideal APZ requirements;
· In most cases the setback line is in front of the houses, or beyond the property altogether;
· In a couple of cases, the setback line is beyond 2 properties in depth.
Bushfire Evacuation
Risk areas have been declared in the Middle Harbour Catchment. They lie between
the sub-catchments of High Ridge and Rocky Creeks St Ives and also in
In this catchment,
development along the valley slopes is the most vulnerable. Once again, long
broad fingers of vegetation can carry bushfires deep into the suburbs of
Wahroonga, South Turramurra, Pymble,
The
As can be seen from
the APZ setback line in figure B3 in Appendix B, in this area of the catchment:
· A little under half the properties have the house setback along the ‘ideal’ APZ;
· The setback line is beyond 1 to 4 properties along more than half its length.
The westerly winds
drive bushfire through a relatively narrow area of bushland, directly into the
path of residential development. Not all of this area is well served by fire
trails. A number of houses have been
lost to bushfire in this catchment.
A number of Bushfire
Evacuation Risk areas have been declared in South Wahroonga and
There will be some
risk from fire to cultural assets of Aboriginal and European significance. No
specific treatments are applied to these sites under the Hornsby-Ku-ring-gai Bushfire Risk Management Plan, however,
consideration of these items is required during planning for hazard reduction
works or fire trail creation and maintenance. Some of these assets are in
inaccessible locations, making them difficult to specifically protect during a
bushfire event.
There are a number of
built heritage assets scattered lightly throughout bushfire prone land,
however, the vast majority of these assets are closer to more developed areas.
The risks to these are similar to the dwellings adjacent to them, however, the
heritage dwellings were not built to modern bushfire construction standards.
The urban areas on
the Ku-ring-gai bushland interface primarily feature aged housing stock of
brick and tile construction. Such structures are highly vulnerable to ember
attack, which accounted for over 90% of house losses in both the 2003
Newer developments in these areas have been constructed since
the introduction of PBP. They are more
likely to be built to construction standards more appropriate in a bushfire
risk area, and to include measures such as Asset Protection Zones, and in some
cases, static water supply. More recent
subdivisions are also more likely to have considered emergency access.
Nevertheless, as PBP allows more leeway for infill developments, recognising
that full compliance is not possible in many of these circumstances, these
areas will still be vulnerable.
Other infrastructure at risk within bushfire prone lands in Ku-ring-gai includes:
· major electricity lines – 2 major lines to the north, and a line to the east, as well as a smaller line within the Lane Cove catchment;
· power lines along the urban streets – these are all overhead lines. Note that not only is this infrastructure vulnerable to bushfire, it can also contribute to fire danger;
· overhead phone lines along the urban streets.
Figure 9: Age structure of Ku-ring-gai Council LGA
4.2.
Social and demographic vulnerability and resilience
Social impacts from
bushfire risk may occur in a number of ways, while a number of demographic and
other factors may influence the degree of vulnerability or resilience of the
community.
Societal responses to
bushfires will have to operate within a world responding to climate change,
which is likely to place an unusual strain on all social systems, the
international security system, transport systems and the governmental systems
under which we organize ourselves.
Resilience to climate
change is also a question of the wider societal support mechanisms offered to
communities. State and federal governments in
Ku-ring-gai has a diverse and vibrant society, representing
many groups with various interests, goals, beliefs and voices. 32.6% of
Ku-ring-gai’s population (Ku-ring-gai Council (2010b) are immigrants to
Nevertheless, this diversity may also pose a variety of challenges in regards to bushfire understanding, preparedness and vulnerability. New migrants in particular may not be fully aware of the risks of extreme bushfire events. In comparison to the Sydney Statistical Division (see Figure 9), Ku-ring-gai has:
· A higher proportion of older people – in all age groups over 50;
· A higher proportion of children in the 5 -17 age groups;
· A lower proportion of people within the 18 – 49 age groups, with a significantly lower proportion in the 25 -34 age group.
This means that Ku-ring-gai has a higher proportion of people within the LGA who are most vulnerable to the risks of bushfire, and a lower proportion likely to be able to ‘stay and defend’ their properties.
Like much of
The ability to
maintain an income flow impacts the resilience of a community (Handmer 2010).
For example, illness from heat and smoke may prevent self employed people
maintaining an income, or a fire could burn out cars leaving people with no means
to travel to work. A household whose
income is not jeopardised by
Businesses too are
vulnerable to both direct and indirect impacts of bushfire. Locally owned small
business may be less able to cope with extreme events than larger national or
multinational businesses. Small business plays an important role in
Ku-ring-gai’s economy and may require assistance following an extreme event.
Insurance also seeks
to improve
After the Victorian bushfires of 2009, the Insurance Council of Australia (Sydney Morning Herald, 5 February 2009, pp3) suggests that Australian building codes fall below international standards, and that this, combined with more severe weather conditions is likely to mean that it will be increasingly expensive and difficult for home owners to insure their homes against bushfire.
Residents with poor
mobility are more vulnerable to bushfire risk.
With nearly 20 per cent of Australians suffering some sort of limitation
due to a disability (Australian Human Rights Commission, 2010)
As noted earlier, (see Figure 9) Ku-ring-gai has a greater proportion
of older people, (more likely to have mobility problems), and children 5-17 years
old than the
Further, there are
pockets containing significant numbers of people whose mobility is compromised
because of age, infirmity, illness or a permanent disability.
Impacts may arise
through transport disruption. Within the
LGA the rail line, and major road arteries are generally not within bushfire
prone land, however, the F3, Pacific Highway and the railway to the north
towards the Central Coast have been cut off in the past, stranding residents
and workers from the LGA and the northern areas away from home or from work.
Similarly,
The issue of
evacuation risk from congested exit roads in a number of areas within the LGA
has already been discussed.
With the prevalence
of overhead powerlines in the area, bushfire events often result in a loss of
power, not just to those areas that are within bushfire prone lands, but
extending beyond to include other residential, business and community
facilities.
Extreme events can
have profound psychological effects on society, demonstrated by the words of
one witness to the 1991 storm: “I have never felt so horrifically petrified...
I began feeling empty, lonely" (Kathy Woodall in Lawson-Hanscombe 1991 pp6).
According to
Kiter-Edwards (1998), the level of psychological stress can be linked to
ability to cope with disaster. Residents who are well connected to
(Handmer 2010).
Connectivity in a predominantly dormitory style area is problematic. To some
extent the high levels of education in the Ku-ring-gai community may override
this disadvantage.
McFarlane et al
(1997) investigated psychological stress related to natural disasters. This
issue was also identified by the attendees at Council’s workshop. The
literature also indicates that bushfire has a significant psychological impact
on people. This literature focussed on the Ash Wednesday fires in
Nevertheless, there may be certain sections of the community less able to cope, such as the elderly, especially where they live alone. These people may require support during and after bushfire events.
It is noted, that the above work was undertaken for a specific fire event. However, with likely increases in fire frequency the potential for increased psychological stress on the community should not be underestimated.
Other impacts that
need to be factored in any socio-economic consideration of vulnerability
include:
· Access to support services;
· Isolation of elderly and disabled;
· Impact of social dislocation;
· Health impacts from air borne respiratory irritants;
· Injuries sustained either fire
fighting or during clean up and repair.
Many of these impacts
have economic consequences for Council, as Council provides much of the
post-impact support service. However, in the case of disasters, councils are
supported financially by state and federal emergency funding provisions. While this funding is currently available, if
the frequency and magnitude of extreme weather events occur as predicted, it is
likely there will be a significant draw down effect on emergency funding, as
the trigger for the declaration of a State of
4.3.
Environmental and ecosystem services vulnerability
Ku-ring-gai has a total of approximately 537
vertebrates, 173 invertebrates, 843 floral species, 171 fungi and 26 ecological
communities (Ku-ring-gai Council 2006a, Ku-ring-gai 2007). Of these at least 6
ecological communities, 28 fauna species and 15 flora species are threatened
(State and / or nationally listed). The habitats of the majority of these
animal species are found within bushfire prone land.
Bushfires and extreme
storms do occur naturally and in the absence of climate change and human
impacts are unlikely to cause significant large scale environmental problems;
indeed many ecosystems rely on bushfires. Figure 7 shows that in the last
thirty years the major fires have predominately affected the
First and foremost
urbanisation and intensification of the urban footprint result in the direct
loss of vegetation, habitat and cause habitat fragmentation. Indirect pressures
from urbanisation include weed invasion from gardens to bushland, predation
from domestic animals and increased stormwater runoff causing erosion and
saturating soils rendering them unsuitable for native plants accustomed to dry,
low nutrient conditions. Informal
recreational activity such as mountain bike riding, expand the impact footprint
and disturb areas once isolated from human impacts.
Further, bushfire is
more likely to cause permanent damage to small remnants than large intact
remnants, as it is more likely that the small remnant will be totally affected
by the fire. Urbanisation in Ku-ring-gai
has resulted in a number of small or narrow bushland remnants adjoining urban
development.
Impacts on ecosystems
including threatened ecological communities (TECs) also occur from current
bushfire risk abatement practices. Some
native species benefit from periodic wildfire, others do not. While Council’s
controlled burning regimes take into account the required fire regime for
various species or communities, hazard reduction burns are lower temperature
burns compared to wildfire and the benefits to the natural ecosystem are fewer
and negative impacts more substantial. Compounding this problem is the emission
of air pollution into the atmosphere. CO2 emissions add to the burden already in the
atmosphere increasing the likelihood of weather events that lead up to
increasingly frequent and intense wildfire conditions.
Post fire weed
invasion reduces the ability of an ecosystem to recover after a fire. This occurs when weed species rapidly
colonise the area cleared by the bushfire. Typically weed species can
out-compete native species in the time it takes to colonise an area as they are
highly fecund, whereas natives are much slower to establish. Post fire
environments are harsh, vulnerable to erosion and lack the protection
vegetation provides young plants from elements. Weeds are hardy and withstand a
range of environmental conditions and generally do not require specific
conditions in which to flourish.
The environmental
outcomes are not based solely on the last fire, but are a ‘function of the sequence
of previous fires, their timing and their properties’ Gill (2005 pp72). This
can be exacerbated by the configuration and design of urban areas in proximity
to bushfire prone lands.
The NSW Rural Fire
Service (1998) found that there may have been a permanent altering of the
structure and composition of plant species in the
Figure 10 Fire threshold map, Hornsby-Ku-ring-gai Bush Fire Risk
Management Plan 2010
 Ku-ring-gai’s landscape is dominated by tall
trees, many of which are eucalypts. A number of other species within the
ecological communities in the LGA also burn readily. Indeed, many species have
evolved with fire, and are dependent on specific fire regimes for their
continued survival. From this perspective, many of the local and regional
ecological communities appear quite resilient to bushfire.
Ku-ring-gai’s landscape is dominated by tall
trees, many of which are eucalypts. A number of other species within the
ecological communities in the LGA also burn readily. Indeed, many species have
evolved with fire, and are dependent on specific fire regimes for their
continued survival. From this perspective, many of the local and regional
ecological communities appear quite resilient to bushfire.
Figure 11 Some species have evolved with bushfire. This young Banksia serrata plant was recruited
after the fire that burnt the old tree. B
serrata is a fire sensitive species that recruits seedlings from seed that
is stored in the canopy and released after fire.
However, the risk of
likely increases in frequency and intensity of bushfires increases the risk to
ecosystems that are dependent on specific fire regimes. Council’s Biodiversity
Strategy identifies high frequency fires as a threat to a number of species and
communities (Ku-ring-gai 2006; DECCW 2007). Alterations of the natural fire
regime as a result of climate change, fire suppression or hazard reduction
burns have altered the species composition of vegetation communities in many
forests of
Fire thresholds are
the upper and lower time limits or range of fire intervals recommended for each
vegetation type to support ecologically sustainable fire management. Lower
thresholds aim to ensure that fire intervals are long enough to let vulnerable
species grow to maturity and set
seed, while upper
thresholds aim to ensure that shorter lived species that rely on fire to
regenerate remain in the system. The time between these thresholds (within
thresholds) is the time between fire events that a specific plant or vegetation
community needs to avoid being at risk from a decline in biodiversity.
A decline in
biodiversity usually occurs from too infrequent burning (above the threshold)
or too frequent burning (below the threshold). Other fire factors that also
influence decline in biodiversity are fire intensity, season, extent
(patchiness) and type of fire.
Figure 10 shows the
fire thresholds for vegetation types in the Ku-ring-gai area. Within
Ku-ring-gai vegetated areas are considered either within the threshold or below
the threshold. The areas shown below the threshold have been burnt too
frequently for the protection of the biodiversity.
If increasing hazard
reduction burns to approximately five times the current practice were to be
chosen as an adaptation option, fire sensitive species could also potentially
become locally extinct.
The burning of
vegetation will also impact the fauna, as vegetation provides habitat, shelter
and food for the fauna. Measures to reduce risk of fire exacerbate these
pressures with the clearing of ground storey vegetation for Asset Protection
Zones. The lower layers of vegetation
are home to a number of small birds and mammals. Removing this vegetation at
the interface removes shelter and food that may be critical for survival in
times of fire.
Bushfire to date has
not been identified as a causal link in the localized extinction of fauna from
the Ku-ring-gai area. It is clear from Figure 8 that the bushland areas of
Ku-ring-gai are split north-south by urban development, impeding fauna escaping
fires and exacerbating habitat fragmentation (Ku-ring-gai 2004).
Re-colonising after
fires requires that sufficient plants or animals survive the fire or flee to
adjacent areas to re-populate an area. It therefore requires linked or islands
of vegetation which remain intact in the vicinity to provide shelter and food
for species to survive while the bushland regenerates. Allowing urban pressures
to reduce connectivity or remove or degrade such refuges, may result in an
inability of these organisms to re-colonise due to the lack of a linkage with
another reserve area, resulting in local extinctions.
Council and private bushland within the fingers of vegetation, reaching in towards the centre of Ku-ring-gai, can act as both a biodiversity corridor and (in times of bushfire in the National Parks) a refuge. The burning of these corridors can escalate the impacts of fragmentation. It is worth considering that only certain flora and fauna are sufficiently mobile to take advantage of the corridors and refuges, while others may have increased vulnerability because of their immobility. Fires may cut biodiversity corridors or destroy populations trapped by surrounding human development as has been the case for koalas (Sydney Morning Herald 11-4-2007).
 A
bushfire followed by heavy rain can result in increases in large amounts of
newly exposed soil being washed into streams, rivers and lakes. This can be
very harmful to the water ecology. With increased fires, there will also be
increased post-fire weed invasion, further adding to the vulnerability of the
local ecosystems.
A
bushfire followed by heavy rain can result in increases in large amounts of
newly exposed soil being washed into streams, rivers and lakes. This can be
very harmful to the water ecology. With increased fires, there will also be
increased post-fire weed invasion, further adding to the vulnerability of the
local ecosystems.
Recoverability of
ecosystem assets from wildfire events is variable according to the extent of
the area burnt and ability of species to recolonise. To re-establish pre-fire
conditions may take decades if at all. Fire events on already pressured
ecosystems may cause permanent loss of species. A precautionary approach is to
protect and enhance the existing ecosystems and ecosystem services to improve
their resilience to pressures such as those from altered bushfire regimes. This would need to be achieved in part by
limiting the human pressures on these systems, as well as more active
rehabilitation measures.
While ecological
communities within Ku-ring-gai do form part of a unique system (e.g. Blue Gum
High Forest), Ku-ring-gai is not home to any unique species that cannot be
found elsewhere and Ku-ring-gai’s ecology was not listed in the Australian
Greenhouse Office (2005) report on ‘priority vulnerable systems’ to the impacts
of climate change.
As Australian
ecosystems are naturally fire prone and the seeds of many Australian shrub and
eucalypt species have enhanced germination after fire (
Of vital importance however, are human impacts in combination with altered fire regimes. Should habitats be further fragmented by housing, roads, etc then the risk of local extinctions will increase. These impacts also need to be considered in conjunction with the increased pressure on biodiversity from additional hazard reduction works resulting from urbanisation.
Due to the complex
interactions between all the factors involved, there is a strong potential for
‘systems that are apparently in
reasonable condition altering suddenly to a point where there is no hope of
recovery’ (Beeton et al. 2006
p34).
4.4.
Current response capacity and preparedness
In Ku-ring-gai, the response to a bushfire emergency is met by just two brigades. One brigade, located at Gordon, is provided by the Fire and Rescue NSW. The other brigade (operated by volunteers) is provided by the NSW Rural Fire Service and is located at Golden Jubilee Oval in Wahroonga. Figure 12 shows the current brigade locations. These brigades service the Ku-ring-gai area through a cooperative agreement between the two agencies to ensure the community is provided with the best possible response to incidents. Together they cover 18,000 ha of bushland of which 16,900 ha is National Park estate.
By way of comparison Hornsby LGA has approximately 30,000 hectares of bushland which is made up of 52 percent National Park estate, 17 percent Council managed lands and the other 31 percent being made up of land belonging to the Department of Lands, and private bushland as well as that associated with the RTA and Rail Corp. While this bushland is more than that of the Ku-ring-gai LGA it meets an urban interface of just 47 kilometres. 14,000 houses lie within 130 metres of that bushland (Chen 2005).
In
Ku-ring-gai, the response to a bushfire emergency is met by just two brigades.
Figure 13 displays a comparison of response capability between Hornsby and Ku-ring-gai LGAs. To meet the bushfire response of the Hornsby area 17 NSW Rural Fire Service Brigades are located strategically throughout the Shire with Fire and Rescue NSW units located at Hornsby, Berowra and Beecroft as well as a station located in the adjacent Hills Shire Council at Castle Hill. Hornsby also supports 2 fire towers, 1 training centre and a fire control centre which directs fire operations for both LGAs.
While Ku-ring-gai has a smaller area of bushland reserves it also shares a large proportion of its interface with National Parks and a higher density of residential development in interface areas.
However, to compare the response capability for the two LGAs is difficult as a number of factors come into play. Ku-ring-gai may have a greater capacity to draw on support from brigades of neighbouring areas due to it’s proximity to urban centres, whereas parts of Hornsby are more rural and remote resulting in an increase in response time. In the event of the outbreak of a fire, the first response regardless of what area, will be the best and possibly the most highly attended. Past events have shown that in severe fires it is those properties that come under threat in the hours after the initial call that can suffer the poorest response as brigades are usually stretched to capacity responding to
numerous calls. During large bush fire events brigades within
the area or in neighbouring districts may be responded to areas across
Figure 12 Location of fire agencies within the Ku-ring-gai LGA.
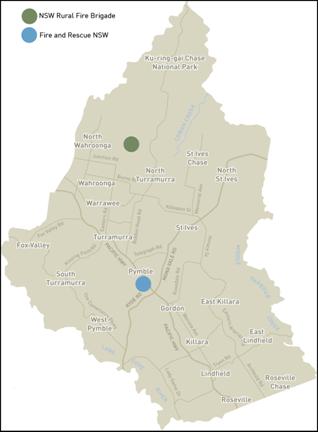
Fire trails play an
important access role in fire suppression and mitigation by:
· Providing
greater access in order to prevent fire spread
· Allowing
fire fighters safer access to more effectively protect properties on the
bushland interface.
· Allow
for a more rapid response to aid fire suppression.
Council’s Access Team
currently manages a 44km network of fire trails throughout the Ku-ring-gai
Council LGA. The maintenance of these
trails as well as the vegetation maintenance of 27 km of walking tracks is
divided into two yearly rotations. Rotation A - Lane Cove Catchment and one
half of Middle Harbour Catchment and Rotation B – Cowan catchment and the
remaining half of Middle Harbour.
Council works with the
Rural Fire Service volunteers on an annual basis to assess the condition of
each trail. This includes accessibility to a range of fire tankers, class
(essential, secondary or dormant), land tenure, assets, condition of the trail
surface and need for vegetation maintenance.
Council also receives
additional funding, usually on an annual basis, through a number of grants[5]
made available to each of the fire districts in NSW, which fund additional
projects such as fire trail upgrades.
Throughout 2009/10 and
2010/11, in addition to the annual maintenance program, Ku-ring-gai has
received additional funding to undertake works on seven (7) fire trails.
However, it is noted that these works are dependent on the continuation of
available funding.
Figure 13
Comparison of response capability
In addition, with climate models predicting an increase in bushfire intensity and frequency and a net decline in available water, access to water for bushfire fighting will also become increasingly problematic.
Mains
water supply is often reduced and unreliable during bushfire events due to the
extreme increased demand for water by residents and emergency services
undertaking property protection. An estimated 95% of households in NSW are
connected to mains supply water (ABS: 2006a).
Hydrants
are utilised by fire agencies which may also significantly reduce the pressure
down the line.
To
partially address the need for water for emergency services, within the
Ku-ring-gai LGA 56 properties have been registered as having a static water
supply available for last resort use by emergency services during a bush fire.
Static water supply I.D plates are available from both fire agencies and
through Council. Residents display their plate in a prominent position e.g. on
the front fence or letterbox. Static water supplies that can be utilised
include water tanks, swimming pools, dams or creeks.
At
the household level some have an independent water supply or fire fighting
reserves in a tank with a petrol or diesel powered pump (unless backup power is
available such as a generator), but it expected that this is uncommon in the
LGA.
60 community fire units have been established in Ku-ring-gai LGA. These units are made up of resident volunteers who are trained by Fire and Rescue NSW to undertake small scale property protection. The majority of these units are within the southern bushfire risk areas, and in Wahroonga and St Ives.
These units support local communities on a street by street basis and free up formal emergency services for more frontline fire fighting.
Bradstock et al
(1998) investigated bushfire risk at the urban interface in
Fragmented vegetation and biodiversity corridors within Ku-ring-gai, necessary for the conservation of biodiversity, increase the potential to quickly spread fire should a crown fire develop. For this reason, Ku-ring-gai requires more attention from the NSW Rural Fire Service to ensure that the 1,100 hectares of bushland managed by Council is done effectively and minimises the impacts to the community, the environment and property.
With a reduced season for hazard reduction burning under climate change, as outlined in the Section entitled ‘Fuel Management into the Future’, pressure will increase on the already stretched resources of the NSW RFS- Ku-ring-gai Brigade and Ku-ring-gai Council to adequately protect the community and its assets. It is likely that more areas will be left vulnerable to future bushfires.
The urban bushland
interface in Ku-ring-gai is intensively developed with most new development at
the interface being infill. People living on the bushland interface need to
prepare their properties for wildfire events. Council provides guidance and
education for residents who wish to minimize their risk of property loss,
however there are a number of constraints, including cost, access, mental and
physical capability and availability of resources. All of these can impact on
the ability of Councils to operate as an educational body and on the residents’
capacity to implement or undertake property protection.
Currently, there are
no mechanisms available to encourage the upgrading of buildings when new
development is not being sought. Properties that are poorly designed and
located in high bushfire risk areas can increase the risk for surrounding
properties, even where the surrounding properties have complied with Planning
for Bushfire Protection 2006. The current
planning protocols provide only limited improvements in terms of property
protection.
In the event of a
bushfire, residents and visitors can respond in two ways:
· Stay to protect the home (and shelter within the home)
· Evacuate to a safe area usually outside
the fire area altogether, or within
designated protection sites within the fire area (see Neighbourhood Safer
Places below).
Increasingly this
option has been encouraged where the property is designed and adequately
prepared for a bushfire event. With increasing recognition that fire fighting
resources will sometimes be spread too thinly to be able to help protect every
property, significant effort and resources are expended on educating residents
in how to prepare the property for the bushfire season, and what to do (and not
do) in the event of a bushfire. Many able bodied residents are now more
experienced and knowledgeable about how to protect their properties as safely
as possible. Others, new to living with bushfire, are still learning.
This is also
supported through development control in bushfire prone areas. Applications for
development within bushfire prone land are required to address the requirements
of Planning for Bushfire Protection 2006 (PBP).
This includes, where possible:
· Designing the building to increase its ability to withstand a bushfire attack;
· Provision of access for fire fighters and equipment;
· The inclusion of Asset Protection
Zones with reduced levels of vegetation and a defensible space for fire fighters.
However, PBP
recognizes that infill sites often cannot meet the full requirements that would
apply to new development on
· the design of the existing development in terms of its ability to withstand bushfire attack;
· setbacks to the hazard incorporating adequate asset protection zones;
· adequacy of access, including perimeter roads.
Household
level communication and planning
The need to boost household capacity to respond appropriately to bushfire events was identified by the Victorian Bushfire Commission (2010). Following this, a number of actions have already been taken in NSW to improve communication including:
· The introduction of the Emergency Alert system, which can
deliver warning messages to mobile and fixed-line telephones;
· A three-fold increase in the call-taking capacity of the
RFS Bush Fire Information Line 1800 679 737;
· Establishment of the RFS website as a ‘one-stop shop’ for
bush fire information in NSW;
· The RFS iPhone™ application, Fires Near Me, designed to
alert people to bush fire activity in NSW;
· Introducing
new fire danger ratings.
The NSW Rural Fire Service has released a range of material and promotional campaigns that include but are not limited to:
· The Prepare. Act. Survive. campaign;
· A revised Bush Fire Survival Plan, including the distribution of about 800,000 copies last bush fire season;
· The rollout of more than 500 Fire Danger Rating signs across NSW, to inform the community about the current fire danger;
· Neighbourhood Safer Places guidelines;
· Development of the Bush Fire Household Risk Assessment Tool, an online resource to help residents identify the level of risk to, and defendability of their property.
All of these initiatives enable an improvement in decision-making and response capacity at the household level.
Ability to evacuate in a bushfire event
Ku-ring-gai contains a number of ‘peninsulas’ of land containing urban development that are surrounded by bushfire prone lands and have limited access and egress. These areas (Figure 2) have been classified by the NSW Rural Fire Service as Bushfire Evacuation Risk areas giving regard to an analysis of data provided in accordance with Australian Standard AS4360 – Risk Management. Additional to this Standard, the RFS applied criteria relating to bush fire risk factors which included:
· Single access/egress into the area
· Bottle necks
· Potential limited access for emergency services
· Isolated development
· Access ways that pass through or are directly adjacent to the identified hazards
· Ridge top development with steep slopes
· Known fire paths/impact areas
· Existing high density of special fire protection development
· Identified traffic flow problems
· Identified mains water pressure
issues
In all, 12 Bushfire
Evacuation Risk areas have been declared in the Ku-ring-gai LGA[6].
These areas contain land that is bushfire prone and land that is not.
In total, approximately 5,200 dwellings are located in the Bushfire Evacuation Risk areas.
The encouragement to
shelter in place, under the ‘stay or go’ policy was not in place at the time
the first areas were certified as Bushfire Risk Evacuation areas, and therefore
did not consider the number of people likely to stay and defend their
properties. However, since the unprecedented intensity of the Victorian Black
Saturday bushfires, and the resultant recent adoption of a ‘catastrophic’
warning category for bushfire days in NSW, it is likely that greater numbers of
residents will evacuate in ‘catastrophic’ bushfire events, than would
previously have been the case.
The evacuation risk
in these areas is recognised by the prohibition of development under SEPP
(Housing for Seniors or People with a Disability) 2004 and of dual occupancy
development under SEPP 53 – Metropolitan Residential Development. However,
state policies are inconsistent in limiting density in these areas with the new
2008 evacuation risk areas not identified under SEPP 53 and none of the
evacuation risk areas are exempted under SEPP (Affordable Housing).
Neighbourhood Safer Places (NSP) is a new concept developed
following the Victorian bush fires in February 2009.
An NSP is an identified building or space within the community that can provide a higher level of protection from the immediate life threatening effects of a bush fire. NSPs still involve some level of risk, both in moving to them and while sheltering in them and cannot be considered completely safe. They are a place of last resort in emergencies only.
The NSW Rural Fire Service has designated the Open Space locations in Table 4 to be used as places of last resort during a bush fire emergency.
The following limitations of NSPs need to be considered:
· NSP do not cater for pets;
· Emergency services may not be present;
· NSP do not provide meals, amenity or cater for special needs (e.g. for infants, the elderly, the ill or disabled);
· NSPs may not provide shelter from the elements, particularly flying embers;
· NSPs are not suitable for people who would be required to travel extensively through fire affected areas to get there.
Table 4 Neighbourhood Safer Places in
Ku-ring-gai
|
Title |
Location |
|
Claude Cameron Grove |
|
|
Gillespie Field |
|
|
|
|
|
Kent Oval |
|
|
|
Palm St & |
|
|
|
|
Regimental Park |
|
|
|
60A |
|
APPENDIX No: 2 - Managing bushfire risks now and into the future |
|
Item No: GB.2 |
5. Consequences of Bushfire Events
Bushfires, especially
major bushfire events, can result in loss of life and property, damage to the
natural environment, loss of biodiversity, impacts on human health and well
being, reduced productivity and financial and economic losses. In addition, it may stretch the resources of
governments at a variety of levels. These areas have been identified in literature
as vulnerable to climate change in many areas of
These consequences
are likely to be more severe under a changed climate. The extent of the
consequences will be influenced by:
· the degree to which climate change can be avoided by contributing to a reduction in CO2 emissions;
· the degree to which fire regimes are altered; and
· the ability of a community to plan for adaptation, and to transform and adapt to external pressures.
Affluent, well
educated and secure communities such as Ku-ring-gai are better able to adapt
than most.
However it is
important to note that no matter how affluent a community might be, it cannot
simply buy its way out trouble. Communities must recognize the need to change
behaviour and attitudes if they are to avoid the worst potential climate change
effects such as bush fire.
5.1. Loss of life and property
Despite the improved management of fire over the last two
decades, losses associated with major fire events in
While there has been
no loss of life from wildfires in Ku-ring-gai to date, loss of life or health
are common consequences of major fires.
The incidence of
major fire outbreaks in
Table
5 Housing losses by state -1939-2009
|
State |
House losses No. |
|
|
6 861 |
|
|
1 530 |
|
|
1 376 |
|
|
548 |
|
|
521 |
|
|
212 |
|
|
43 |
|
|
1 |
|
Total |
11 092 |
Late evacuation is
known to present associated risks.
However, until the Victorian bushfires of 2009, the ‘stay and defend’
strategy was understood to have a reasonable chance of success. Preliminary results from a survey of the
residents of fire affected regions, conducted by the Bushfire CRC, indicated a
range of difficulties experienced by residents leading up to and during the
fire (CIE 2010).
‘The capacity of
those that stayed to defend their homes and properties was inhibited by the
severity of conditions, where heat exhaustion, dehydration, breathing
difficulties and eye irritation may have diminished the capacity to defend
their houses and subsequently their lives’ (Bushfire CRC 2009).
Table
6 Bushfire fatalities 1956-2007 — activity at time of death
|
Activity at time of death |
Fatalities # |
Fatalities % |
|
Late evacuation |
66 |
26 |
|
Defending property from outside |
||
|
Suburban location |
28 |
11 |
|
Rural location |
35 |
13 |
|
Inside defendable property |
||
|
Actively defending |
1 |
<1 |
|
Meagre and unsuccessful attempts to defend |
4 |
2 |
|
Passively sheltering |
26 |
10 |
|
Activities unknown |
4 |
2 |
|
Other |
||
|
Travelling through the
area unaware |
28 |
11 |
|
Waiting rescue |
7 |
3 |
|
Other or unknown |
58 |
22 |
|
Total |
257 |
100 |
|
Data source: Haynes, K. et al. (2008) 100 years of Australian civilian
bushfire fatalities: exploring trends in relation to the ‘stay or go policy’. |
||
Table
7 Housing losses by state and fire event
|
State |
Events |
Housing
losses |
|
NSW |
6 significant bushfires |
100-200 each |
|
|
1939 |
650 |
|
1944 |
434 |
|
|
1983 |
1513 |
|
|
2009 |
2131 |
|
|
ACT |
2003 |
500 |
|
WA |
1961 |
approx 200 |
|
|
1967 |
almost 1300 |
|
|
1983 |
283 |
|
2005 |
90 |
|
|
Source data: CIE: 2010 |
||
5.2.
Human
health and wellbeing
Ku-ring-gai has good access to health services, within and
close to the LGA, providing a level of resilience within the community.
However, stakeholders have predicted that healthcare and emergency services are
likely to be significantly affected by altered fire regimes. In terms of
physical health, fires sometimes result in severe injuries and death.
Conservative estimates by Emergency Management Australia suggest that bushfire
has caused 9,946 injuries (GHD Dec 2008).
During fire events local hospitals are likely to have increased
admissions for injuries as a result of fire fighting activities, as well as the
elderly suffering from respiratory and heat related stress. A study of the
admissions into hospitals with asthma and respiratory related illness during
the ’94 fires in western
While, as a whole Ku-ring-gai’s community, is likely to be relatively resilient to the psychological effects of bushfire disasters, certain sections of the community less able to cope, such as the elderly, especially those that live alone, and those that have had major losses are nevertheless likely to require support during and after bushfire events.
There are instances of community disharmony when decisions
have to be made over which houses to save (
Bushfires can also cause a decrease in air quality, and is already a common cause of air pollution within Ku-ring-gai (Ku-ring-gai 2004). On a more local level, hazard reduction burns also increase air pollution. Pollutants include particulates which can cause breathing problems to people susceptible to respiratory problems such as asthma.
Loss of natural habitat and threatened ecological communities also impacts economic and social implications. Stakeholders have identified that TEC’s and biodiversity generally are of social significance, as well as contributing to the higher property values in many areas of the LGA. If bushland reserves were decimated by poor management or ill-advised climate response strategies, the highly prized natural assets that contribute the area’s intrinsic value could be permanently compromised.
Historically
bushfires have frequently impacted upon Ku-ring-gai and even without climate
change this would continue to be the case. However, economic information on
bushfires is limited and scattered.
While there may be
some positive economic effects of altered fire regimes on the local
construction industry, through the need for reconstruction of properties in the
area, this positive impact is minor compared to the massive losses associated
with fire. Bureau of Transport Economics (BTE) (2001) found that damages generally
impact negatively as a whole.
Estimates of costs to
Economic losses
associated with bushfire are generally reported across the state as a whole,
rather than by region, or LGA. Within Ku-ring-gai, private property damage and
the destruction of Council’s natural and built assets are the major potential
direct economic impact of bushfires. However, the economic costs of damage to
natural systems and to health and wellbeing are more difficult to assess.
At a finer scale, the
most relevant and detailed economic data is associated with the 1994 fires.
This is mainly for private properties, and this data does not reflect the cost
of fire to Council.
No properties were
affected in the Ku-ring-gai area during the 2001-02 fires. The next most recent
fire event with relevant information is the
Council may need to
find additional funds (eg from rates) to cover extra insurance expenses,
reducing funds available for other programs. Council contribution to the RFS
has increased by 1% since 2000, while funding from the treasury has decreased
by 1%. Council may have to ensure that public buildings are suitably adapted
against danger and may need to self-insure.
Loss of productivity
is a common consequence of fire. Losses related to business and productivity on
top of insured losses has also been estimated for the Ash Wednesday fires to
have been significant, however the uninsured losses associated with the
Losses to bushfire on
the insurance industry rank fifth in
The average loss for houses destroyed in major or significant bushfires between 1926 and 2009 is shown at Table 8 (CIE 2010). The estimates for the value of houses destroyed and value of insured losses for property damage are presented in today’s prices or present value terms.
Table
8 Major and significant bushfire events and cost
|
Bushfire event |
Year |
Present value of insured losses |
Average losses per house destroyed |
|
$ million |
$ |
||
|
Black Saturday - |
2009 |
1,350 |
630,000 |
|
|
2003 |
414 |
850,000 |
|
Ash Wednesday SA & Vic |
1983 |
856 |
340,000 |
|
|
1967 |
1,058 |
820,000 |
|
Black Friday Vic |
1939 |
939 |
720,000 |
|
Black Sundaya |
1926 |
unknown |
unknown |
|
|
2005 |
32 |
630,000 |
|
|
1994 |
Unknown |
430,000 |
|
Lara |
1969 |
87 |
n.a. |
|
Dandenong |
1962 |
270 |
600,000 |
|
Note: A major bushfire event is an event with over 450
houses burned or loss of greater than five lives in a one week period. A
significant event is where over 50 houses are destroyed and there is
significant loss of life. Data
source: Emergency Management Australia database 2010. Adjustments made for
inflation — based on RBA Inflation Calculator. In CIE (2010). |
|||
The cost of bushfire
varies according to the number of houses destroyed, displaying a direct
positive relationship with insured losses. The average insured losses for every
house destroyed in ‘major’ or ‘significant’ bushfire events, between 1926 and
2009, has ranged between $340,000 and $850,000.
Set methodologies
developed and in current use (BTE 2001) for estimating losses associated with
natural disasters generally, are based on an estimation of costs from data on
floods, because of the extensive knowledge of floods. Economic and financial
losses can be classified as follows:
Direct
Tangible: Damage
to infrastructure, buildings and contents, vehicles, boats, etc;
Loss
of biodiversity and ecosystem services;
Indirect
Tangible: Loss of
production- volunteers
are extensively involved in managing bushfire events, resulting in a loss of
productivity from their usual employment/activity;
Emergency responses and relief - NSW already has the world’s
largest fire service. Funding for the RFS primarily comes from insurance
agencies (73.7%), with 13.3% from local government and 13% from the treasury (NSW RFS 2007).
Clean-up
costs (time and resources);
Fuel management measures;
Fire trail creation and maintenance;
Loss
of biodiversity and ecosystem services;
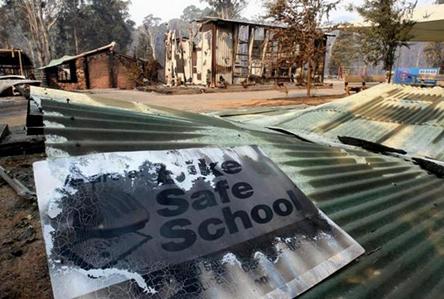 Figure 14:
Direct
Intangible: Death
and injury – financial impacts on families;
Loss
of items of cultural significance and personal memorabilia;
Increasing insurance costs as a result of:
· Additional claims;
· Increased funding for RFS (Insurance agencies currently provide 73.7% of the funding for RFS);
· Potential changes to insurance coverage. Council’s own insurance classes bushfires as ‘Acts of God’ and does not pay out on them, shielding Council from the increased premiums but leaving Council uncovered in case of disaster unless the State or Federal government steps in;
Indirect Intangible: Inconvenience and disruption, especially to schooling and social life; Stress induced ill-health (physical, psychological) – exacerbated by an ageing population;
Mortality.
Increasing frequency
and intensity may result in the permanent alteration of the structure and
composition of ecological communities within Ku-ring-gai, exacerbated by urban
fragmentation and degradation. Flora and
fauna species and habitat may be lost, even entire ecological communities, and
ecological services degraded (Pitman et
al 2007).
However, it is the
combined impacts of altered fire regimes in a changing climate with human
settlement impacts that have the potential for the greatest consequences to
ecosystems and ecosystem services.
Bushfire management practices may further amplify these consequences. Planning for any urban expansion needs to be
mindful of this consequence.
Some particular flora
species may be positively affected, while fauna species are likely to be
negatively affected, especially those whose habitat lies within fragmented
remnants, such as
· Acrobates pygmaeus (Feathertail Glider)
· Antechinus flavipes (Yellow-footed Antechinus)
· Antechinus swainsonii (Dusky Antechinus)
· Isoodon macrourus (Northern Brown Bandicoot)
· Perameles nasuta (Long-nosed Bandicoot)
· Pseudocheirus peregrinus (Common Ringtail Possum)
· Petaurus breviceps (Sugar Glider)
Four threatened
ecological communities ‘are all likely to suffer a loss of species if subject
to repeated high frequency fires’ (Ku-ring-gai Council 2006a p25), being Blue
Gum High Forest, Sydney Turpentine Ironbark Forest, Duffy’s Forest and Sydney
Coastal River-flat Forest.
 .
.
Ancillary effects of
bush fire include:
· Exposure of soils facilitating higher rates of soil erosion and sedimentation in waterways (Beeton et al. 2006) especially when heavy rain follows a bushfire;
· Reduced catchment yield (Lavoral & Steffen 2004);
· Loss of canopy cover;
· Reduced ability for the vegetation
to absorb increasing concentrations of CO2, thereby feeding the climate
loop.
The management of
fuel between fires, as well as emergency management, can have similar adverse
consequences for the natural environment; eg through:
· Direct loss of vegetation and habitat;
· Selective canopy, and understorey clearing for APZs;
· Increasing fire frequencies even further, with resultant impacts on species and habitats as described above.
Ku-ring-gai Council
is required to protect biodiversity under Threatened Species legislation. As
such any response strategy needs to carefully consider both the intended and
unintended consequences of any choice. Well designed and managed responses in
the Ku-ring-gai area are likely to become critical to the future conservation
of ecological assets. While human life
and property will always take precedence where questions of conflict arise
between people and the bush, it is nevertheless possible to construct responses
that reduce risk while conserving the remaining natural assets for future
generations to enjoy.
1.
Council will have to
consider a variety of costs, from emergency services, repairing structures and
buildings to the eventual cleanup and possible replanting of vegetation in
Ku-ring-gai in response to bush fire events. Adapting and responding to bush
fire risk will not be without cost. In
order to reduce any risk exposure to an acceptable level, preventative and combative
responses will need to be considered.
Recommendations
within two key documents have been used to determine Council’s response to bush
fire risk. These documents include:
Victorian
Bush Fire Royal Commission Final Report (2010)
Lessons learnt from
the 2009 Victorian bushfires (Victorian Bushfires Royal Commission (VBRC) 2009)
include a clear recognition that local government has a significant
responsibility to play a preventative role to make communities safer.
The Victorian Bushfire Commission (VBRC, 2010) has also included a number of recommendations in relation to planning as a result of the catastrophic 2009 bushfires, which also have relevance to other bushfire risk areas, such as Ku-ring-gai. The response options considered here take into account the recommendations of the Commission, as well as the NSW Government’s response to them.
Ku-ring-gai
Council Climate Change Adaptation Strategy (2010)
Council has
undertaken extensive consultation with experts and the community regarding
potential options for adaptations to bushfire risk from climate change
(Ku-ring-gai 2010). A list of options was developed, and then tested against a
set of questions designed to rank each adaptation against financial, social and
environmental performance, and the ability of the adaptation action to reduce
the risk. These options are also considered within this section.
In addition, the Hornsby/Ku-ring-gai Bush Fire Risk Management Plan (2010), and the Ku-ring-gai Bush Fire Prone Land Map and Bush Fire Evacuation Risk Map (2008) are used to identify and prioritise those areas where responses are required.
Response
options
In addition to
addressing the current risk from bushfire events, responses to bushfire risk
need to include measures to allow for adaptation to increased frequency and
intensity of bushfires in Ku-ring-gai.
While there is already a high risk from bushfire in some areas that
needs to be addressed in a range of ways, climate change raises the priority of
implementing measures to address this risk in Ku-ring-gai.
The options for responding to risk from bushfire have been grouped as follows:
· Reducing the hazard
· Improving the resilience of the current community
· Reducing the vulnerability of the future community
· Emergency response
· Research and measurement
However it should be noted that a number of actions would contribute to more than one outcome. For instance, community education would provide benefits for both the existing and future residents; fire trails provide emergency access, but also a line from which to back-burn; undergrounding power poles reduces ignition sources, while also reducing the potential loss of electricity infrastructure during a bushfire.
There is still a
common perception that increasing hazard reduction burning can adequately
mitigate the risk of bushfire and that therefore other (non-emergency) measures
are not required. This perception has been challenged on a number of occasions.
Bradstock (2008)
sought to determine if bushfire mitigation strategies were likely to succeed in
reducing bushfire risks under climate change. Data from Hennessey et al (2005) was used for both the
‘high’ and ‘low’ climate change projections for 2050. It was determined that
mitigation was possible under the ‘low’ projection scenario. He found that
biodiversity at the broad scale would not be affected adversely by increased
fire frequency. However more research is needed at the local level. To meet
this mitigation target for the ‘low’ scenario, up to 5% of the total landscape
would need to be burnt through fuel management programs. In other words, hazard
reduction burns will need to increase by at least five times current practice
(Bradstock, 2008) to achieve the same level of protection.
While hazard reduction burning will still play a significant
role in bushfire mitigation in Ku-ring-gai, it is clear that it can only be
one of a range of measures to minimise the risks
For the
Hornsby–Ku-ring-gai District, 5% of the total bushland under management equates
to 2,920 ha. This would mean raising the best efforts of the district a further
2,120 ha. Achieving this would require more than a threefold increase in
resources, funding and commitment from the district land managers and an
exponential increase in volunteer numbers.
Government financial and
resource constraints
make this level of management unfeasible.
The situation is even
worse under the Hennessey et al (2005)
‘high’ scenario. To reduce risk under
this scenario, a 50 to 100% increase in prescribed burning is required. The
impact on the Hornsby–Ku-ring-gai district would be to raise fuel management
targets to a minimum of 29,200 ha. At the broad scale this would adversely
impact biodiversity by shortening fire intervals. At a micro scale, this may
manifest in local extinctions through to habitat loss.
Even if commitment
targets to fuel management outlined in Bradstock et al (2008) could be achieved, only half of the risks will be
mitigated. Further, research has indicated that hazard reduction burns have
limited value.
While hazard
reduction burning will still play a significant role in bushfire mitigation in
Ku-ring-gai, it is clear that it can only be one of a range of measures to
minimise the risks.
It is recommended
that a more strategic approach to hazard reduction burning be adopted in order
to make the most of the available resources.
In addition to
controlled burning for hazard reduction, ecological burning, i.e, burning to
maintain vegetation communities within their identified fire thresholds, may be
undertaken. While these burns are mainly aimed at biodiversity enhancement,
they also reduce the bushfire hazard for nearby development.
To minimise impacts
on biodiversity from controlled burning, whether ecological or hazard
reduction, significant knowledge, planning and resources are required.
Controlled burn regimes need to consider the required fire regimes for the
species and communities affected by the burn:
‘Creating a mosaic of fire regimes across a landscape—with fire intervals, seasons and intensities in the mosaic appropriate for particular ecosystems—appears to be the best means of sustaining biodiversity and should be a goal of both ecological and fuel-reduction burning. There will still be trade-offs, because fuel-reduction regimes that threaten biodiversity might have to be applied in particular circumstances to achieve adequate risk reduction’ (COAG 2004).
Council’s ability to
undertake pre- and post- fire weeding is dependent on the availability of
funding. This is currently provided through the Environmental Levy.
Additionally, these
burns are usually the last priority due to resources / available burn days and
therefore often do not get undertaken.
It is recommended
that Council continue to support the ecological burn program.
The Victorian Bushfire Commission (VBCR 2010)
recommended:
· The
progressive replacement of all SWER (single-wire earth return) power lines in
Victoria with aerial bundled cable, underground cabling or other
technology that delivers greatly reduced bushfire risk. The replacement program
should be completed in the areas of highest bushfire risk within 10 years and should
continue in areas of lower bushfire risk as the lines reach the end of their
engineering lives
· The
progressive replacement of all 22-kilovolt distribution feeders with aerial
bundled cable, underground cabling or other technology
that delivers greatly reduced bushfire risk as the feeders reach the end of
their engineering lives. Priority should be given to distribution feeders in
the areas of highest bushfire risk.
In response the
NSW Government (NSW Government: 2010) states that;
‘the
bush fire risk management plans required to be completed by each electrical
distributor under the provisions of the Electricity
Supply (Safety and Network Management) Regulation 2008, are being reviewed in light
of the Royal Commission recommendations and to allow for consistency with local
bush fire risk management plans.
Much
of the network in NSW bush fire prone areas consists of multiple phase lines,
which have improved protection equipment compared to the SWER network in
At
the end of their design life, replacement options for 22kV and other high
voltage lines are reviewed with consideration given to appropriate options that
contribute to reducing risks in bush fire areas.
RFS has met with electricity providers to carry out a review
of risk assessment policies, processes and standards.’
Council could consider the inclusion in the Development Control Plan of controls requiring undergrounding of power lines for larger developments and subdivisions on bushfire prone land. This could be included as conditions of consent for these developments.
6.2.
Improve resilience of current community
The VBRC (2010) identified the need to provide information on ways in which existing buildings in bushfire-prone areas can be modified to incorporate bushfire safety measures. The RFS is to review PBP to include a section on retrofitting bush fire protection measures for existing homes (NSW Government: 2010).
Increasing the
percentage of existing development that is compliant with AS3959-2009 (Australian Standard for new developments in
bushfire lands), particularly in relation to improving the
ability to withstand ember attack, is viewed as a viable and effective way to
reduce infrastructure loss (Ku-ring-gai Council, 2010a).
Council could do this through education and incentives such as rate rebates or organising bulk discounts for increasing the fire resilience of dwellings on bushfire prone land. Providing a discount or rebate on fire resilient installations in homes was identified by Council (Ku-ring-gai Council: 2010a).
It is recommended that Council investigate options to encourage retrofitting of existing properties, in consultation with RFS.
Education and instruction on emergency response procedures prior to a bushfire event can improve the resilience of a community. This applies to local businesses as well as residents. This is the responsibility of the emergency services and Council (Ku-ring-gai Council 2010a).
The Victorian Bushfire Commission recognised that people needed a range of options to increase their safety in the event of bush fire. The commission found that many people who intended on ‘staying and defending’ appeared to panic when the severity of the fires became apparent and attempted to leave (VBRC cited in ABCB 2010a). Although a ‘stay-or-go’ policy existed at the time it was established that ‘…many people did not have a well thought out plan and were left to make their own decisions without the benefit of assistance from the authorities…’ (VBRC 2010).
The Commonwealth and some states have made progress implementing initiatives to support household level planning for bushfire events, as described in the section on Vulnerability and Resilience. Further work in this area is continuing.
The RFS also leads a Bush Fire Arson Task Force which is developing arson prevention programmes (NSW Government 2010).
Council will also contribute (with RFS and others) to bush fire education, as part of its responsibilities in meeting the BFRMP. It has started the following programmes, however further work is required in these areas:
· Community education sessions for special fire protection purpose groups i.e retirement villages;
· General fire education at Council events;
· Distribution of Firewise kits to residents adjacent to Council bushland reserves.
Council (2010a) in consultation with a number of experts, including Fire and Rescue NSW, adopted a strategy identifying an option for risk management into the future to include an increase in the number of community fire units to improve community self-sufficiency and awareness. The formation and training of CFUs is now likely to be provided by RFS.
The Victorian Bushfire Commission (VBRC 2010)
recommends that landowners on developed sites should be explicitly enabled to
take reasonable steps to reduce bushfire risk to an acceptable level (guidance
on ‘acceptable level’ to be provided), and that councils should be able to
identify areas where this should not apply.
In NSW the Bushfire Environmental Assessment Code for NSW (RFS 2006) is used
by the RFS to help landholders streamline existing environmental legislation
related to hazard reduction, where a Development Application is not required.
To gain environmental approval, a landholder can apply for a Bush Fire Hazard
Reduction Certificate, which is determined by the RFS using the Code. Where a
plan of management applies to the land, hazard reduction works consistent with
the plan of management and the Code are permitted without further consent.
Approvals for development applications and
Major Development under Part 3a of the EP& A Act in bushfire prone areas
usually include conditions of consent in relation to the provision of
APZs. APZs are intended:
‘to
provide sufficient space and maintain reduced fuel loads, so as to ensure
radiant heat levels at buildings are below critical limits and to prevent
direct flame contact with a building’ (NSW RFS 2006).
Planning for Bushfire
Protection also describes the requirements for APZs,
including not only the separation of the building from the hazard, but also
fuel reduction measures such as canopy cover and connection and the management
of mid and understorey vegetation.
Landscape plans need to address these requirements. However, anecdotally,
certifiers are not ensuring that this takes place on the ground. Council’s
Climate Change Adaptation Strategy (2010a) identifies this as an issue to be
resolved.
It is up to the resident to maintain the APZ
over the life of the development. The extent to which this occurs is not known.
Regular assessment of landowners’ compliance with such conditions of consent is
required. Certifiers are currently required to assess compliance with bushfire
conditions only at or on completion of construction. No follow-up over time (eg
of the maintenance of asset protection zones) is required of the certifier. The
VBRC (2010) identified the need to improve compliance with hazard reduction
measures in development consents. The
NSW Government (NSW
Government: 2010) has stated that it supports the
establishment of a working party comprising relevant NSW government and other
agencies to progress regular compliance assessment, however no funding has been
provided to support continuing compliance assessment.
For less able-bodied residents of bushfire
prone land the NSW Government has introduced the AIDER program. At the time of
writing this had treated over 400 properties, helping vulnerable, disabled,
infirm and elderly residents to reduce their property’s fire risk.
To support residents in hazard reduction on
their properties, Council could subsidise bulk green waste removal and chipping
services in high risk areas. This could be targeted at the same time as the
annual maintenance of APZs is recommended under PBP, i.e. around September.
The issue of enforcing consent conditions that have been applied through the consideration of Planning for Bushfire Protection 2006 has been discussed in relation to APZ management. The issue of enforcement is also important in ensuring that the approved construction levels and landscaping design are actually implemented. The degree of enforcement is currently heavily dependent on Principal Certifying Authorities. An education program for certifiers may be needed. Ideally this would be run by the RFS.
Static water supply
With climate models predicting an increase in bushfire intensity and frequency and a net decline in available water, bushfire fighting will become increasingly problematic. Alternative sources of water will be required.
In order to combat
the shortfall in water availability, the Victorian Environmental Protection
Agency has already approved the use of treated effluent for firefighting
purposes.
The Victorian Bushfire Commission (VBRC 2010) recommended that people in areas at risk of bushfire should have a static water supply, because reticulated water supplies may fail in a bushfire event.
In
NSW Planning for Bushfire Protection 2006 (PBP) also recognises that
additional sources of water (ie. non mains supply) are essential to providing
greater protection for a dwelling and its occupants during bushfires when mains
supplied water can be inconsistent, reduced or non-existent.
The
amount of water needed is dependent on differing geographical and topological
conditions. The determination of available water supply is made by the water
supply authority.
PBP
specifies non-reticulated water requirements for subdivisions, dual
occupancies, and townhouses and units.
PBP
also provides conditions for fire hydrant spacing, sizing, pressures and
materials and to ensure that they are not compromised by parked cars or
traffic.
Where
non-reticulated water supplies are required, suitable connections for fire
fighting appliances must be provided and be accessible to fire trucks.
Above-ground tanks are specified to be made of concrete or metal, with metal
fittings and shielded pumps.
Council could consider applying
conditions of consent to smaller developments that include water tanks within
areas of bushfire risk, to provide appropriate fittings to tanks. Similarly,
development conditions could be applied to pools to require registration as a
static water supply site, and that the sticker be affixed at the front
boundary. This would increase the amount of water available to firefighters in
a bushfire event. The area to which such conditions would apply could be either
all Category 1 and 2 bushfire prone lands, all bushfire prone lands, or areas
identified as extreme risk in the BFRMP. As these conditions would not be
overly burdensome, it is recommended that such conditions be applied to
development on all bushfire prone lands.
In its second interim report the Commission expressed its concern about the need for a minimum standard to regulate the design, siting and construction of bunkers, the risks of misplaced reliance on bunkers, the demand for bunkers, and the widespread availability of bunker products (VBRC, 2009b).
Complex safety issues such as location relative to the house and fire sources, air management and maintenance surround bunker construction, make them potentially life- threatening. A series of detailed standards are required to address these issues. Currently, interim regulations have been introduced in the form of a Performance Standard for Private Bushfire Shelters, which was released on 30 April 2010. It provides detailed design considerations and acceptance criteria to assist building practitioners and certifiers to achieve compliance (ABCB, 2010b). The standard provides for safe access and egress, appropriate number of occupants, a means of deterring external
environmental conditions, identifying the building for rescue purposes, how other nearby features (both structural and geographical) may affect the integrity of the structure, its ability to withstand fire intensity, provision of sanitary and other facilities and prevention of untenable conditions. The ABCB has also proposed that private bushfire shelters be classified as a class 10c building (class 10 being a non-habitable building or structure) under the Building Code of Australia (BCA) (ABCB 2010a).
A number of agencies have expressed concern that consumers are likely to put too much faith in the ability of a private bushfire shelter to protect their lives. A discussion paper released by the Australasian Fire and Emergency Service Authorities Council (AFAC) considers that bunkers should be a last-resort option and may be worthy only in situations where other protection measures cannot mitigate the effect of bushfires.
Nevertheless, they may provide an option for improving resident safety where the existing development cannot be upgraded satisfactorily, and where residents choose this option for themselves. In these circumstances, residents are more likely to educate themselves about both the limitations and the maintenance requirements.
Council (2010a) recognised the need to identify and support residents requiring property maintenance assistance in high risk areas.
However, since the report of the Victorian Bushfire Commission (2010), the NSW Government (NSW Government 2010) has stated that it will provide additional funding to establish a Vulnerable Communities Unit within the RFS to better plan for the protection of those people who are particularly susceptible in a bushfire. The Vulnerable Communities Unit will be involved in:
· ‘The development of strategies to protect
lives of vulnerable community members, including their identification;
· The integration of Neighbourhood Safer
Places, safer precincts, evacuation centres and community protection plans;
· Providing specialist advice to Local
Emergency Management Committees and Bush Fire Management Committees regarding
the needs of vulnerable people; and
· Identifying the need for further assistance
through the existing Assist Infirm, Disabled and Elderly Residents (AIDER)
program’.
Victorian Bushfire Commission (VBRC, 2010), discussed specific zoning for bushfire prone lands to prohibit uses such as dwellings on existing lots, however this was considered inequitable for landholders. Instead it recommends:
‘The State develop
and implement a retreat and resettlement strategy for existing developments in
areas of unacceptably high bushfire risk, including a scheme for non-compulsory
acquisition by the State of land in these areas.’
The Climate Change Adaptation Strategy (Ku-ring-gai Council: 2010a) identified compulsory property acquisition as an option. However, Council’s Acquisition and Divestment of Land Policy (Ku-ring-gai Council: 2009) does not encourage compulsory acquisition. Based on recent experience, such an option is likely to be unacceptable to the community at this time.
Land swaps and transferable development rights are also suggested by the commission as alternatives to direct land acquisition in extreme circumstances.
The NSW Government (NSW Government: 2010) does not support a retreat and resettlement strategy and states that it relies
instead ‘on a comprehensive suite of
measures to manage the risks of bush fires to communities.’
It is recognised that the considerable public resources required for such property purchase or land swap are unlikely to be available at this time, either at a state or council level. This option is not recommended.
Council will need to fund many of the activities required to prevent the loss of EEC’s and biodiversity. Current mapping of the TECs in Ku-ring-gai is enabling decision-making to consider these assets in the future. Council will need to continue undertaking works on public land to prevent or address erosion and sedimentation and weed invasion in areas where vegetation is lost due to fire. Current mapping of the vegetation and the conservation significance assessment undertaken in the Draft Biodiversity and Riparian Zones Study will help to prioritise limited funding and resources for these purposes.
Under the Draft NSW Biodiversity Strategy (NSW
Government: 2010a), it is proposed that DECCW and RFS review the standards for
the protection of biodiversity within the Model Bushfire Risk Management Plan
and the Bushfire Environmental Assessment Code for NSW to incorporate climate
change projections and minimise the impact of bushfire management on
biodiversity.
Council’s Climate Change Adaptation Strategy
(Ku-ring-gai Council 2010a) includes an action to clear breaks through some of
the key broader fingers of vegetation, both to prevent fire being drawn in
close to the centre of the LGA, and to provide refuge areas for wildlife. The best location
(from both bushfire and environmental perspectives)
for such breaks would need to be identified prior to the emergency, and could
be allowed to regenerate after the emergency is over.
The Strategy (2010a) also identifies the following
potential actions:
· Notification of wildlife carers in post burn work;
· Identification of veterinary care capacity;
· Constructing habitat boxes from non-combustible material;
· Utilising water sensitive urban design, to minimise weed impacts (and therefore fuel loads) at the bushland interface;
· Conservation of biodiversity corridors that link with reserves.
Note that the latter two actions will be considered under other aspects of planning for the LGA. Further research is required to ascertain whether wildlife will use non-combustible habitat boxes, and the best materials to use.
6.3.
Reduce vulnerability of future community
The findings and recommendations of the National Inquiry on Bushfire Mitigation and Management (Ellis et al, 2004) includes the following:
‘The Inquiry supports the view, expressed in Natural Disasters in Australia, land use planning that takes into account natural hazard risks is the single most important mitigation measure for preventing future disaster losses (including from bushfires) in areas of new development. Planning and development controls must be effective to ensure that inappropriate developments do not occur.’ (Finding 6.1)
This
is supported by Moritz and Stephens (2007), who state that:
‘To achieve a more sustainable coexistence with wildfire in future WUI [Wildland Urban Interface] areas, there are two fundamental goals to achieve. The first is to adopt urban planning guidelines that reduce the expansion and exposure of the WUI itself, producing more compact urbanized areas with less convoluted boundaries. While this shift may present a host of political challenges, it is one of the few ways to produce future communities that both minimize their ecological impact and are more easily defensible in a wildfire situation. The difficulty of evacuating people from WUI communities during wildfires is another solid justification for limiting expansion of the WUI. (Cova 2005).
While
the NSW Government (NSW Government 2010) does not support state level strategic land use
changes, nevertheless it has been involved in changes to construction standards
for bushfire prone lands, and it has also supported strategic exemptions for
bushfire risk evacuation zones.[7]
With a projected increase in the frequency and intensity of fires due to climate change, there is a need for land use planning to avoid:
· placing more people and assets at risk from bushfire
· intensifying the risk to existing residents and assets and
· placing more stress on an already stressed environment.
The Victorian Bushfire Commission (VBRC, 2010) recommended that:
1 Planning objectives should give priority to the protection of human life;
2 As a whole, planning provisions for bush fire prone areas should be strengthened;
3 In some areas where the bush fire risk is extreme, development, including new subdivision of existing areas, should not be permitted;
4 People should be strongly discouraged by the planning system from living in areas where it is not possible to have the minimum defendable space without unacceptable costs for biodiversity. It should be made explicit that a subdivision without defined building envelopes around which minimum defendable space can be created will be approved only if exceptional circumstances can be demonstrated (eg alternative safety measures are applied). A minimum lot size for a dwelling should be provided for in planning instruments (by zone);
5 There is a need to review the currently accepted 100m buffer between houses and vegetation.[8]
In relation to 1) to 4) above, the NSW Government (NSW Government: 2010) responds that:
· The NSW RFS already has sufficient legislative authority to assist in the regulation of developments in bush fire prone areas across the State;
· PBP provides guidance to Councils, developers and builders for planning and building in bushfire prone areas and must be met for development to proceed;
· Primacy of life for new developments is absolute in this process.
In relation to 5) above, it is agreed that the 100m buffer should be reviewed, however this review needs to be undertaken on a broader basis than by LGA.
The Commission (VBCR: 2010) also recommends the strengthening of existing zones to influence the use and development of land for vulnerable groups, such as child care, hospitals and schools. In NSW these types of development are ‘Special Fire Protection Purposes’ under the NSW Rural Fires Act 1997, and are ‘integrated development’ under the EP&A Act. Such developments are assessed by the RFS in accordance with specific requirements in PBP. Despite this, a need to provide greater strategic limitations on seniors housing has been recognised by the state government, eg. for bushfire risk evacuation areas under SEPP (Housing for Seniors and People with a Disability) 2004.
Council, in considering the need for adaptation to climate change (Ku-ring-gai Council 2010) has also recognised the need to rezone land or otherwise restrict development in high bushfire risk areas.
One way to improve resilience to bushfire risk for new development is by imposing construction standards. PBP and the associated Australian Standard 3959 provide guidance for the construction standards required, dependent on the level required under PBP. PBP will continue to be updated by the state government as the results of further research leads to policy changes. It is expected that resulting construction will provide greater resistance to bushfire, and increased safety to residents in bushfire prone lands.
The issue of bunkers has been discussed above. With the inclusion of a standard for bunkers, Council could consider imposing conditions of consent to require bunkers as part of future development, where other mitigating factors are inadequate. However, the inclusion of a bunker is not a substitute for appropriate location and design of a development and reliance on them to address the risk of bushfire is not appropriate.
There is a danger that requiring bunkers as a condition of consent will lead residents to assume that this will ensure their safety. Further, bunkers require maintenance to continue to meet the required standards, maintenance which cannot be guaranteed for the life of the development.
Accordingly it is recommended that Council avoid requiring bunkers as a condition of consent for new development.
Cova (2005) identifies a range of factors that affect the capacity to evacuate from areas with a high risk of bushfire. These factors include the degree of hazard, road length per household and the road capacity, type of land use (eg residential or tourist), the number and location of exits from the danger area, and the presence of a fuel buffer to the exit roads. These characteristics are typical of a number of locations in Ku-ring-gai, however Ku-ring-gai also has the presence of a major arterial road limiting the ability for evacuation of residents in fire events. This problem is further exacerbated in times of fire due to poor visibility, confusion and fear as people try to escape. Increasing the number of residents in these areas will only make these issues worse in fire events and has potential to end in disaster.
Cova (2005) argues that fire prone communities at the bushland interface should have a maximum occupancy rate, dependent on the above factors. Based on research in a number of US communities that have experienced major bushfires, he proposes a minimum number of exits based on the number of households in the sensitive area, in a similar way to controls in building codes that specify the number of exits required for a building with the capacity to cater for a particular number of people. This is shown in Table 9. Note that the table could also provide guidance to
an appropriate dwelling density within an area with a given number of exits.
Table 9 Minimum Exits for Interface Communities.
Source: Cova (August 2005)
|
Number of households |
Minimum number of exiting roads |
Maximum number of households per exit |
|
1-50 |
1 |
50 |
|
51-300 |
2 |
150 |
|
300-600 |
3 |
200 |
|
601+ |
4 |
|
Appendix D summarises the number of exits in relation to the number of households in each evacuation risk zone in the LGA.
The number of exits was also a factor in the considerations in the identification of Bushfire Risk Evacuation Areas (Figure 2) for SEPP 53 and SEPP (Housing for Seniors and People with a Disability). For such evacuation risk areas there is a strong argument for the incorporation of planning measures such as zoning and minimum lot size/depth within the Principal LEP to prevent significant increases in density, or development types that cater to more vulnerable people. The choice of planning measures may be specific to all the bushfire risk evacuation zones, or only those that exceed the maximum number of households per exits recommended by Cova (2005). Figure 16 identifies the number of existing households within each bushfire risk evacuation zone. Of these, ten areas (identified on the map by the numbers 1, 2, 3, 5, 6, 10, 13, 14, 14a and 15a) exceed the maximum number of households per exit.
Planning measures could therefore be applied either to the evacuation risk zones as a whole, or to the higher risk zones only, or a combination of these, dependent on the planning measure.
|
APPENDIX
No:
2 - Managing
bushfire risks now and into the future |
|
Item
No:
GB.2 |
Figure
16 Number of dwellings in the Bushfire Evacuation Risk Zones under SEPP (Seniors Housing and Housing
for People with a Disability) 2004, broken down into 22 zones. Source: Ku-ring-gai Council, January 2011
|
APPENDIX No: 2 - Managing bushfire risks now and into the future |
|
Item No: GB.2 |
Table 10 Location of evacuation risk areas
|
Evacuation risk area |
Key road/s |
|
Number |
|
|
1 |
|
|
2 |
Bobbin
|
|
2a |
|
|
2b |
|
|
3 |
|
|
3a |
|
|
4 |
|
|
5 |
Eastern
|
|
5a |
Woodvale
Cl |
|
6 |
|
|
7 |
|
|
8 |
|
|
9 |
|
|
10 |
Parker
|
|
11 |
Ravenhill
Rd/CarinaRd |
|
12 |
|
|
13 |
|
|
14 |
Browns
|
|
14b |
San
hospital and surrounds |
|
14a |
|
|
15 |
|
|
15a |
|
The use of a
minimum lot size for subdivision is a potential planning tool to minimise the
number of additional people living in areas of high risk, supported by the
Victorian Bushfire Commission (2010) and Council (Ku-ring-gai Council:
2010a). Setting the minimum lot size at
a size at least that of existing lots would prevent further subdivision in high
risk areas. A minimum lot size of 1,500m2
for residential zones (as applies to the E4 zone under the Ku-ring-gai LEP (Town centres) 2010
(KLEP)) and 1 hectare
for existing low density Residential 2(g) zones, would prevent subdivision of
most low density lots. Such a provision would support the principles outlined
in legislative requirements and planning strategies both related to bushfire
and to climate change, including Planning
for Bushfire Protection and Section 117 Direction No 4.4 and is
specifically recommended in Council’s Climate
Change Adaptation Strategy (2010a) and the Victorian Bushfire Commission’s
report. This provision could be applied
at a range of scales or locations.
An alternate way of preventing inappropriate subdivision in these areas would be the inclusion of a local clause in the LEP specifying that subdivision is not a permitted development type in relation to these lands.
A standard for
minimum lot depth for subdivision could be used to ensure that any future
subdivision is designed to provide an adequate setback to development for
defendable space and asset protection.
It would also have the effect of reducing the potential for increasing
the number of people in areas at risk from bushfire. Such a provision would support the principles
outlined in legislative requirements and planning strategies both related to
bushfire and to climate change.
Appendix E
outlines the method used to determine suitable lot depths. The minimum depths
recommended would vary dependant on the ‘effective slope’, that is the slope
(measured through 100m) in the direction of the greatest fire hazard, as per Planning for Bushfire Protection 2006. The
recommended minimum lot depths from the hazard are shown at Table 10. The minimum lot depth would be calculated
from Category 1 and 2 vegetation, as identified on the Ku-ring-gai Bushfire Prone Lands Map. This would allow for changes
to the line of the hazard, with the regular updates to the Bushfire Prone Lands Map, without the need to amend the LEP.
Table 11 Recommended minimum lot depths
|
Upslope/flat - 5 o |
>5 o - 10 o |
>10 o |
|
55m |
65m |
90m |
This provision
could also be applied at a range of scales or locations. For instance, if
minimum lot sizes are applied as recommended above, minimum lot depths could be
applied to sites within bushfire prone lands that are not covered by an
increase in minimum lot size. Minimum lot depth could be applied across sites
that contain lands within the lower minimum lot depth calculated based on PBP
as outlined above. In most cases this would affect 1 to 2 lots deep from the
hazard.
All sites will require zoning consistent with
the Standard LEP Instrument. This
instrument limits the number of zones that are available to Council. The following zones could be used where there
is high risk during bushfire events:
E3 –
Environmental Management
The objectives of this zone under the Standard LEP Instrument relate to the provision of development that will allow the protection, management and restoration of areas with special ecological, scientific, cultural or aesthetic values.
This
zone has not previously been used in Ku-ring-gai. According to the Department
of Planning (2009) this zone is for land
‘where there are special ecological,
scientific, cultural or aesthetic attributes or environmental hazards/
processes that require careful consideration/ management and for uses compatible
with these values’.
The application of the E3 – Environmental Management zone where land is constrained by hazards is recognised by the Department of Planning (2009). An additional local objective related to bushfire would support the application of this zone.
Mandatory land uses to be included in the zone are restricted to dwelling houses and home occupations, roads and environmental protection works, while there is also a mandatory set of prohibited uses. The land-use table could prohibit uses that would increase the evacuation risk in these areas, (such as secondary dwellings, seniors housing, dual occupancy and bed and breakfast), uses that may result in combustible materials being stored or used on the site, as well as uses that are inappropriate adjacent to areas of significance for their ecological values. Similarly development types that are used by the more vulnerable members of the community should be prohibited.
It is noted however, that there are a number of developments in the highest risk areas that cater for vulnerable people, including schools. The Department of Planning requires that schools be zoned according to the adjoining land use (NSW Department of Planning 2010). This would mean that the E3 zone would be applied to schools in these areas. It is not recommended that schools be a permitted use. To ensure that the existing schools can continue they would need to be listed under Schedule 1-Additional Permitted Uses in the Principal LEP.
This zone could be applied to all Category 1 and 2 bushfire prone lands within the evacuation risk zones or only within those that are assessed as the highest risk using Cova (2005) and/or extreme risk in the BFRMP (Hornsby and Ku-ring-gai Councils: 2010).
E4 –
Environmental Living
This zone has been used by Ku-ring-gai in the KLEP. The objectives within the KLEP relate to the provision of low-impact residential development in areas with special ecological, scientific or aesthetic values. Under the KLEP these sites also have increased minimum lot size requirements, to prevent inappropriate subdivision. This zoning would fit well with the urban nature of Ku-ring-gai. An additional local objective related to bushfire would support the application of this zone.
Mandatory land uses to be included in the zone are restricted to dwelling houses, home occupations, roads and environmental protection works, while there is also a mandatory set of prohibited uses. The KLEP also prohibits uses that cater for vulnerable people.
Additional permitted uses in the E4 zone under the KLEP include bed and breakfast accommodation, group homes and secondary dwellings.
This zone could be applied generally within higher risk evacuation risk zones (to land that are not identified as Category 1 or 2 bushfire prone lands), and/or to Category 1 and 2 bushfire prone lands that are not within the highest risk evacuation zones.
E2 – Environment Conservation
The objectives for this zone are primarily related to the protection and restoration of areas of ecological, scenic, cultural or aesthetic values.
Dwelling houses can be prohibited within this zone. It is
therefore most appropriate for reserves, or as a split zone on larger private
sites.
However there are a number of sites that are currently split between residential and open space zones. Where the natural values of these areas are high, the open space zones could be translated into E2 zones. This is discussed in Council’s background study on Biodiversity and Riparian Lands (Ku-ring-gai Council 2011).
Environment
Protection zones generally
Residential zones allow a number of uses through other environmental planning instruments. For instance, SEPP Affordable Housing applies to the bushfire risk evacuation areas at present, allowing applicants to bypass Council’s plans, and increase density in these areas. However, development under this SEPP is not permitted in an environment protection zone. It is recommended that Council seek an amendment to SEPP Affordable Housing to exclude its provisions from Bushfire Risk Evacuation Zones.
Zones
E2 to E4 will generally need to be supplemented by detailed provisions in the
development control plan. These would most likely cover the design,
construction and management of uses in these zones, particularly with respect
to dwellings (Department of Planning: 2009). It is recommended that such
provisions be included in the comprehensive DCP.
Business zones
There are a number of bushfire evacuation risk areas that contain neighbourhood centres. It is recommended that these business areas be retained, and rezoned in accordance with the standard LEP instrument. These areas are not considered to add significantly to the risk, and provide much needed services and facilities for the local areas.
The above controls could be applied to different areas
within the LGA. Different controls will be more appropriate for some areas than
others. For instance, minimum lot sizes would control increases in density in
evacuation risk zones, while minimum lot depths would help to ensure that
future development can be located to provide an adequate asset protection zone.
The following areas all have the potential (and in some cases have been) to be adversely impacted by bushfire events, and may be considered appropriate lands to which to apply controls. Some of these areas overlap with each other, such as Category 1 and 2 bushfire prone lands, which will be found both inside the evacuation risk zones and outside them.
Some estimates
have been prepared of the number of properties that would be affected by
proposed zoning and standards (see below). The standard considered most likely
to reduce the development potential of a site is the increase in minimum lot
size. Accordingly, figures are included in some scenarios, that identify the
number of land parcels that currently have at least twice the minimum lot size
under the KPSO. This would include, for instance, parcels within the
2c-Residential zone, which have a lot size of at least1858m2 (ie
twice the minimum lot size of 929m2 under the KPSO). This does not
mean that all such sites would actually be affected by an increase in the
minimum lot size provision, as other controls under the KPSO and other
legislation would come into play, such as a larger minimum lot size for a
battleaxe allotment, width of required access handle or the need to protect
significant vegetation or riparian zones. Accordingly the estimates provided
below are likely to be an overstatement of the number of sites impacted, but is
the best available information.
Sites that contain category 1 and 2 bushfire prone
lands
These sites contain vegetation that is, and/or links to, a bushfire hazard. Life and property are generally at their most vulnerable in these locations. Further subdivision, or construction close to the hazard, would increase the potential number of residents and assets that may be impacted by radiant heat or direct flame in a bushfire event. Alternatively, significant impacts on the environment are likely to occur from clearing for hazard reduction.
Rezoning and restrictions on land use, minimum lot sizes and/or minimum lot depths could be applied to these sites generally, or where they are located within particular risk areas.
Lands
containing a site within 55m of the hazard
Restricted land uses and/or minimum lot depth could be applied across sites that contain lands within 55m of the hazard, identified as Category 1 and 2 vegetation in the Bushfire Prone Lands Map.
This could be applied within all bushfire prone lands or only to sites located in certain risk areas.
Bushfire
prone lands - buffer
Applying an E3 or E4 zone or controls such as minimum lot depth or size to the buffer areas would reduce the number of people and assets within a significant area likely to be subject to ember attack, as well as smoke, in a bushfire event.
However, many of these areas contain much smaller extents of
vulnerable vegetation, and further from the hazard, are more likely to include
adequate defendable space, eg including a road. The applicability of the
controls could be limited to those areas at extreme risk during a bushfire
event.
Areas within
extreme risk identified in the Bushfire Risk Management Plan
These areas
are identified in the BFRMP and refer to the degree of risk to assets. They
include the northern part of the North Turramurra Evacuation Risk Zone and
Bushfire Prone Lands Buffer and Category 1 and 2 adjacent to larger bushland
parcels and National Parks. A detailed and consistent assessment process was
undertaken to determine the risk categories.
It is
recommended that at a minimum, Category 1 and 2 lands within these areas should
have controls applied to reduce risk to future residents and development during
bushfire events. This could include appropriate zoning and land use
restrictions, minimum lot depth and/or minimum lot size.
There are 251
residential land parcels (or parts of parcels where there is a split zoning)
that are currently twice the minimum lot size permitted under the KPSO that are
within either category 1 or 2 bushfire prone land and within the area of
Extreme Risk identified in the BFRMP.
Areas
within the highest risk evacuation risk zones
Increasing the
minimum lot size within the evacuation risk zones that do not meet the criteria
for the number of exits would reduce the number of people and assets within a
significant area likely to be subject to ember attack and smoke, in a bushfire
event. Importantly, it would also reduce
the potential for increasing the number of people trying to leave the area
where there is a very high risk of not being able to evacuate safely.
It is
recommended that at a minimum, these areas should have minimum lot sizes
applied to avoid increasing the already high evacuation risk to residents and
visitors during bushfire events. Environmental protection zoning within the
extreme risk areas identified in the BFRMP (Hornsby and Ku-ring-gai Councils
2010) is also recommended.
There are
3,460 land parcels within these evacuation risk zones, almost 1000 of which are
within the
Of the total
3,460 residential parcels, 143 parcels are at least twice the minimum lot size.
Eleven (11) parcels are currently zoned 2(g) –Residential and developed only
with low density development, having a minimum lot size of approximately 1
hectare under the KPSO.
All areas
within the bushfire evacuation risk zones
The
application of a greater minimum lot size would reduce the number of people and
assets within a significant area likely to be subject to ember attack, as well
as smoke, in a bushfire event. It would
reduce the potential for increasing the number of people trying to leave the
areas where the RFS has identified a risk to safety during evacuation in a
bushfire event.
There are 5210
properties in evacuation risk zones[9]
in Ku-ring-gai LGA.
Of this total,
213 parcels are at least twice the minimum lot size. Again, eleven (11) parcels are currently
zoned 2(g) –Residential and developed only with low density development, having
a minimum lot size of approximately 1 hectare under the KPSO.
Planning
options
There are a
number of combinations of the identified lands above, to which zoning and
planning controls could be applied. Three options are identified below, which
would achieve different levels of risk reduction, dependent on the area. These
options are recommended for consideration in the Principal LEP.
Option 1:
a. Retain the one hectare lot size for existing Residential 2(g) lands, and increase the minimum lot size for all other residential, school lands within the 10 evacuation risk zones that do not meet the exit criteria outlined in Appendix D;
b. Apply the recommended minimum lot depth standard to sites which contain or are adjacent to bushfire prone lands category 1 or 2, located within areas of extreme bushfire risk identified in the BFRMP (Hornsby and Ku-ring-gai Councils: 2010);
Option 2:
e. Retain the one hectare lot size for existing Residential 2(g) lands, and increase the minimum lot size for all other residential, and school lands within the 10 evacuation risk zones that do not meet the exit criteria outlined in Appendix D;
f. Apply the E3 – Environmental Management zone to sites that contain bushfire prone lands category 1 or 2 within the 10 evacuation risk zones that do not meet the exit criteria outlined in Appendix D, and within areas identified as extreme bushfire risk in the BFRMP (Hornsby and Ku-ring-gai Councils: 2010);
g. Apply the E4 – Environmental Living zone to all other sites that contain bushfire prone lands category 1 or 2, identified as extreme bushfire risk in the Bushfire Risk Management Plan 2010;
h. Apply the recommended minimum lot depth standard to sites that contain lands within 55m of Category 1 or 2 bushfire prone lands, that are located within areas of extreme bushfire risk identified in the BFRMP (Hornsby and Ku-ring-gai Councils: 2010);
i. Add an objective to the E3 and E4 zones in relation to minimising risk from bushfire events;
j. Prohibit bed and breakfast, group homes, secondary dwellings and schools in the E3 zone;
k. Include assisting schools in the Environment Protection zones in Schedule 1 as additional permitted uses.
Option 3:
a. Retain the one hectare lot size for existing Residential 2(g) lands, and increase the minimum lot size for all other residential, and school lands within all the evacuation risk zones;
b. Apply the E3 – Environmental Management zone to sites that contain bushfire prone lands category 1 or 2 within all the evacuation risk zones, and within areas identified as extreme bushfire risk in the BFRMP (Hornsby and Ku-ring-gai Councils: 2010);
c. to g. As for Option 2.
Option 1 would impose the minimum number and type of restrictions to the least number of properties, while avoiding increasing the risk to those areas at the most severe risk from bushfire events either because of likely danger during any evacuation, or because bushfire prone vegetation is located on the site.
Option 2 would additionally ensure that future subdivisions in proximity to the hazard in the extreme risk areas allow for adequate setbacks for defence during a fire. While this option would increase the number of sites affected, the additional risk management is reasonable, even more so, given the likely impacts of climate change.
Option 3 extends the restrictions under Option 2 to areas of high risk, and would provide the greatest level of risk reduction for the future. However, it would also affect the greatest number of properties, reducing development potential in these areas.
Option 2 is recommended as the appropriate level of risk management.
Measures to protect biodiversity and ecological processes
Many measures to address bushfire risk involve the removal of vegetation and habitat, with consequences for biodiversity and a number of other ecological processes. The protection of human life and property are always the overriding concerns under the NSW Rural Fires Act 1997.
Nevertheless, bushfire and biodiversity protection need to be considered in an integrated manner if we are to ensure that ecological integrity is also protected.
For example, while biodiversity corridors and
connections between remnants may be undesirable due to their ability to
transfer and spread fire, they are critical for wildlife movement, access to
feeding and water resources and as habitat.
In line with the mapping by DECCW for the Sydney
Metropolitan Catchment Management Authority (DECCW:2008a), Council has
identified regional fauna habitat and biodiversity corridors within Council’s Draft Biodiversity and Riparian Lands Study 2011. Fauna habitat within DECCW (2008a) was mapped
at a large scale, and does not take into account the need for fuel management
on private property. It is important that Council’s Conservation Significance
Assessment for Ku-ring-gai and the controls for the mapped areas of
significance consider the need for bushfire mitigation. The Conservation
Significance Assessment has considered this in a number of ways. For instance,
where DECCW (2008a) mapping includes bushfire prone vegetation close to private
dwellings, Council’s Regional and Local Fauna Habitat mapping has been modified
to facilitate the creation of an APZ between residential structures and areas
to be protected as fauna habitat. It should be noted that no detailed
assessment of residential requirements against Planning for Bushfire Protection (RFS, 2006) was undertaken and it
is acknowledged that creation of fire mitigation measures within Regional and
Local Fauna Habitat areas identified may still be required.
It is recommended that detailed controls in the
comprehensive DCP support the protection of biodiversity and ecological
processes, to improve the resilience and recoverability of these processes to a
number of threats including bushfire. Provisions can include matters related to
development within areas of conservation significance, tree retention, the
utilisation of water sensitive urban design and landscaping, for example. This detail is beyond the scope of this
study.
It is noted that Council’s Draft Biodiversity and
Riparian Lands Study also makes recommendations in relation to LEP zoning,
and provisions such as minimum lot size. Some areas that are not identified
within this report as high priority for the application of LEP rezoning or
other restrictions may nevertheless be considered to have high ecological value
which would warrant the imposition of such measures. This may also occur in the
reverse.
The Victorian Bushfire Commission (VBCR: 2010)
recommends the development and administration of:
‘a collective offset
solution for individual landholders who are permitted to remove native
vegetation for the purpose of fire protection.’
This is not supported within the NSW Government: (NSW
Government: 2010), which states that it seeks to rely on existing hazard
reduction processes which include, in some instances environmental assessment
under the Bushfire Environmental Assessment Code for New South Wales
(RFS: 2006).
However, where a reasonable
development proposal would require the removal of significant vegetation, NSW
already has a state-wide offsetting mechanism available under the NSW Threatened Species Conservation Act 1995,
the Biobanking Scheme. To supplement
this, Council is also preparing a biodiversity offset policy for the LGA. It is
noted however, that these offsetting schemes only apply to new development, not
to hazard reduction for existing developments, where the NSW Rural Fires Act 1997 overrides other legislation in relation to
biodiversity.
6.4.
Emergency Response
While bushfire evacuation risk areas have been identified which are usually dependent on a single road for access and egress, there are no standards or codes that govern the design or management of these single roads as evacuation routes. In the absence of such a code, there have been occasions where these roads have been altered in ways that may reduce their efficacy as evacuation routes.
Tentatively, the performance criteria for access roads contained in the Planning for Bushfire Protection 2006 (RFS: 2006) would be a useful tool to ensure that accessibility is maintained on evacuation roads during an emergency response (note that this differs from roadway capacity).
Relevant performance criteria include the intent to provide public road widths and design that allow safe access for firefighters, while residents are evacuating an area.
Acceptable solutions to realise this intent may include:
· 2 way roads (min 8m wide);
· Traffic management devices that facilitate access by emergency vehicles;
· Road curves of appropriate radius to allow for access;
· Appropriate longitudinal grades, crossfall and vertical clearance.
Existing single roads providing access and egress to bushfire evacuation risk areas satisfy the above solutions in that they currently carry 2 way traffic and have been designed for vehicles that regularly use that part of the road network, which typically include waste collection trucks. These roads often are also bus routes and therefore can accommodate vehicles up to large rigid trucks/buses.
Traffic controls (eg traffic signals, roundabouts and priority intersections) would normally affect the capacity of egressing traffic in the event of an evacuation. However, under emergency conditions, (uninterrupted) priority can be given to egressing traffic, which would increase the normal (interrupted) capacity of the access road. Improved guidance systems could also be considered, which could include pavement reflectors on key access roads and signposting.
A study paper from the
Another option for reducing the risk in evacuation risk areas during bushfire events would be the provision of additional exits, to provide alternative evacuation routes (Ku-ring-gai Council: 2010a).
This would require the construction of new roads from the at-risk area, and detailed investigations would need to be undertaken to determine suitable linkages so that new roads do not pass through valleys or through/into other risk areas. However, it is likely that dwellings or land would need to be acquired, resulting in potential impacts to residents and other landholders. Further, the acquisition of land and construction of new roads may be cost prohibitive to Council.
Ku-ring-gai Council (2010a) identified an option to audit key fire evacuation routes and develop a minimum standard or code. To supplement this, evacuation route signage was proposed.
It is recommended that Council:
· Undertake an audit of each of these road access routes to/from evacuation risk zones;
· Investigate whether any standards or codes currently exist for such roads in other jurisdictions;
· Prepare a code for the design and/or management of these roads as evacuation routes;
· Prepare a program to implement any required upgrades.
The construction of new fire trails was identified in Council’s Climate Change Adaptation Strategy (Ku-ring-gai Council 2010a). Fire trails play an important access role in fire suppression and mitigation, but also play a significant role in reducing the hazard.
As noted previously, upgrades and extensions are dependent on
grants. It is recommended that Council continue to apply for grants to upgrade
and extend the fire trail system.
Among other recommendations in relation to the emergency phase of bushfire management, the Victorian Bushfire Commission (2010) suggests a number of improvements to communication systems, both between and within the fire management services, and between the fire management services and the public, as well as measures to improve safety for the most vulnerable members of the community.
A number of actions have already been taken in NSW, as outlined in the Section ‘Vulnerability and Resilience’.
The NSW Government (NSW Government: 2010) has also promised:
· Funding for the establishment of Rapid Aerial Response Teams, to be strategically located along the NSW coastal slopes and ranges during the bush fire danger period thereby providing an increased aggressive initial attack on fires;
· Upgrade of the RFS’s pager and radio network;
· Identification cards for bushfire brigade volunteers;
· Review of Guideline 33, Guideline for network configuration during high bushfire risk days, which provides a methodology to NSW Network Operators for making decisions on whether different network configurations should be used during high bush fire risk days.
As identified in the section on ‘Response Capacity’, Ku-ring-gai has only two fire brigades, one being Fire and Rescue NSW and one NSW RFS. Council’s Climate Change adaptation Strategy (2010) identified the potential for an additional NSW RFS brigade to be established to boost the capacity to deal with bushfire events in the future. Figure 17 identifies a potential location for a brigade.
A new brigade would involve a large financial cost at a time that volunteer numbers are dropping.
Nevertheless, an appropriate zoning for a new fire brigade should be considered, in case circumstances change in the future. This could be done through one of two mechanisms:
· Zoning appropriate location(s) as one of the ‘prescribed zones’ that permit ‘emergency services facility’ under SEPP Infrastructure 2007. These include a number of rural, business, industrial, open space and special zones;
· Permitting ‘emergency services
facility’ as a land use in appropriate location(s) –either as a standard use in
the zone, or as and additional permitted use within Schedule 1 of the LEP.
Figure 17 Potential new fire brigade location
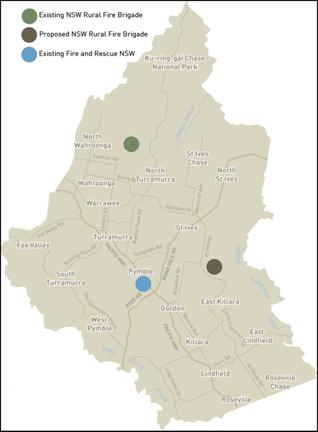
6.5.
Research/Measurement
The Climate
Change Adaptation Strategy (Ku-ring-gai Council: 2010a) has identified a number
of areas where additional research would be valuable such as:
· Selective weeding;
· Identification of sections of corridors or ‘fingers’ of vegetation that can be cleared in an emergency;
· Fast decomposing bacteria to reduce fuel - carbon sequestration, or mechanical removal;
· Viability of non-combustible habitat boxes ;
· Mapping areas of:
· non fire tolerant vegetation communities,
· phytophthora locations,
· wildlife refuges.
The first two items and the last above are
most likely to be within the scope of a council or particularly relevant to
Ku-ring-gai and could be considered in the work programme over the next few
years. It is noted that mapping of key vegetation communities within Ku-ring-gai
has been undertaken (Ku-ring-gai Council: 2009a) and broad mapping of non fire
tolerant vegetation communities are identified within the Bushfire Risk Management Plan (2010), fire threshold map. In
addition, testing and mapping of suspected phytophthora
locations has been undertaken by Council since 2007. Wildlife refuges have not
been mapped.
In relation to the emergency clearing of corridors, it is important to note that Council’s Draft Biodiversity and Riparian Lands Study (2011) identifies areas of regional fauna habitat and biodiversity corridors. It is recognised that there are occasions when emergency clearing of vegetation is undertaken in a bushfire event. The identification of sections of biodiversity corridors/ regional fauna habitat that are less sensitive and have greater capacity for regeneration, may allow for more carefully targeted clearing in a bushfire event. It is noted however that decisions to clear fire breaks will be foremost determined by behaviour and location of the individual fire.
Research from the bushfires experienced in Victoria in 2009 has informed and will continue to inform amendments to the Australian Standard AS3959 – 2009 Construction of Buildings in Bushfire Prone Areas, Planning for Bush Fire Protection 2006 (PBP 2006) (NSW RFS, 2006), the Environmental Planning and Assessment Act 1979, the Rural Fires Act 1997, NSW Rural Fire Service policies and various building codes.
While a number of
changes have been made to PBP as a result of the Victorian Bushfires of 2009,
as described in the section on legislation, a number of issues are still being
researched and provisions will be included in future amendments. These include:
· The effect of wind on tiled roofs;
· Effectiveness of sarking;
· Appropriate ember protection.
These issues need to be researched at a broader level than Council.
6.6.
Summary of recommendations
It is recommended that Council:
Reduce the
hazard
1 Adopt a strategic approach to hazard reduction burning, and continue to design the burn regimes to minimise impacts on biodiversity;
2 Consider the inclusion in the Development Control Plan of controls requiring undergrounding of power lines for larger developments and subdivisions on bushfire prone land;
3 Include the undergrounding of power lines as conditions of consent for larger developments and subdivisions on bushfire prone land;
Improve resilience of current community
4 Investigate options to encourage retrofitting of existing properties, in consultation with RFS;
5 Continue its bushfire education and awareness raising programme;
6 Consider subsidising bulk green waste removal and chipping in high risk areas, to support management of APZs;
7 Continue to support the ecological burn program.
8 Apply conditions of consent to developments that include water tanks within all bushfire prone lands to provide appropriate fittings to tanks and that developments that include pools or other static water supply display SWS stickers;
9 Keep a register of wildlife carers and veterinarians to allow them to be notified in post burn work.
Reduce
vulnerability of future community
10 In the Principal LEP apply the following zoning and provisions:
a. Retain the one hectare lot size for existing Residential 2(g) lands, and increase the minimum lot size for all other residential, school lands within the 10 evacuation risk zones that do not meet the exit criteria outlined in Appendix D;
b. Apply the E3 – Environmental Management zone to sites that contain bushfire prone lands category 1 or 2 within the 10 evacuation risk zones that do not meet the exit criteria outlined in Appendix D, and within areas identified as extreme bushfire risk in the Bushfire Risk Management Plan 2010;
c. Apply the E4 – Environmental Living zone to all other sites that contain bushfire prone lands category 1 or 2, identified as extreme bushfire risk in the Bushfire Risk Management Plan 2010;
d. Apply the recommended minimum lot depth standard to sites that contain lands within 55m of Category 1 or 2 bushfire prone lands, that are located within areas of extreme bushfire risk identified in the Bushfire Risk Management Plan 2010;
e. Add an objective to the E3 and E4 zones in relation to minimising risk from bushfire events;
f. Prohibit bed and breakfast, group homes, secondary dwellings and schools in the E3 zone;
g. Include schools in the Environment Protection zones in Schedule 1 as additional permitted uses.
11 Avoid relying on bunkers as a condition of consent for new development;
12 Use land use controls and operational measures to improve the resilience to altered fire regimes of vulnerable vegetation and habitat as per Council’s Draft Biodiversity and Riparian Lands Study 2011.
13 Include more detailed provisions in the comprehensive DCP to support the Environment Protection Zones.
Emergency
response
14 Permit ‘emergency services facility’ as a land use in appropriate location(s) –either as a standard use in the zone, or as and additional permitted use within Schedule 1 of the LEP;
15 Undertake an audit of each of the road access routes to/from evacuation risk zones;
16 Investigate whether any standards or codes currently exist for such roads in other jurisdictions;
17 Prepare a code for the design and/or management of these roads as evacuation routes;
18 Prepare a program to implement any required upgrades to these evacuation routes;
19 Continue to apply for grants to upgrade and extend the fire trail system.
Research
20 Consider including research into the following in the work program over the next 2-3 years:
a. selective weeding to reduce bushfire risk;
b. the identification of sections of corridors or ‘fingers’ of vegetation that can be cleared during an emergency bushfire event;
c. viability of non-combustible habitat boxes.
It is also recommended that the following issues be raised with relevant state agencies:
21 The review of the 100m buffer in light of the significant proportion of houses that were destroyed beyond the 100m buffer line in the Victorian bushfires of 2009;
22 Research:
a. The effect of wind on tiled roofs;
b. Effectiveness of sarking;
c. Appropriate ember protection;
23 Provision of funding to enable the promised establishment of a working party comprising relevant NSW government and other agencies to progress regular compliance assessment, however no funding has been provided to support continuing compliance assessment.
24 Establishment of an education program on bushfire construction and landscaping for APZs for private certifiers;
25 The need for an amendment to SEPP Affordable Housing to exclude its provisions from Bushfire Risk Evacuation Zones.
1
1
|
APPENDIX No: 2 - Managing bushfire risks now and into the future |
|
Item No: GB.2 |
7. References
Ahern A. and Chladil M, 1999 How far do bushfires penetrate urban areas?, in Cary, G., D.
Lindenmayer, and S. Dovers (Eds.) 1999 Australian Disaster Conference,
Emergency Management of Australia., Canberra, A. C. T.
Atkinson, G. 1984 cited in G.A. Chapman G.A and C.L. Murphy C.L,
1989 Soil Landscape Summaries of
the
Australian Building Codes Board, 2010a Consultation
Regulation Impact Statement (RIS 2010-03) Proposal
to amend the Building Code of
Australian Building Codes Board, 2010b Performance Standard for Private Bushfire Shelters 2010 Part 1, Australian Building Codes Board.
Australian Bureau of Statistics 2006 Basic Community Profile Hornsby- Ku-ring-gai (2006), Accessed online: http://www.abs.gov.au/AUSSTATS/abs@.nsf/d8874b08a9e70711ca2570960003cd61/0e69c10a27511b75ca2570dd0023a57c!OpenDocument
Australian Bureau of Statistics,
2006a Cited in Fire and Rescue NSW, Static
Water Supply (SWS) www.nswfb.nsw.gov.au/page.php?id=319
Updated November 2010. Accessed 3/2/2011
Aon Insurance, 2003,
The January 2003
Australian Climate Group 2004 Climate change solutions for
Australasian Fire Authorities Council (AFAC) Message,
http://www.afac.com.au/awsv2/about/message.htm 13-5-2007
Australian Fire Authorities Council 2005 Accidental Fire Fatalities in Residential Structures: Who’s at risk? Australian Fire Authorities Council
http://www.afac.com.au/awsv2/publications/documents/ResidentialFireFatalitiesReportOctober2005.pdf 13-6-2007.
Australian Greenhouse Office 2005 Climate Change Risk and Vulnerability by the Allen Consulting Group, Department of Environment and Heritage, Commonwealth of Australia, Canberra.
Australian Greenhouse Office 2006, Climate Change Impacts & Risk Management: A Guide for Business and
Government Australian Greenhouse Office, Department of Environment and
Heritage, Commonwealth of
Australian Human Rights Commission 2010, Climate Change and Human Rights, Online:
http://www.hreoc.gov.au/human_rights/climate_change/index.html Accessed November 2010
Beer, T. & Williams, A. 1995 Estimating Australian forest fire danger under conditions of doubled carbon dioxide concentrations Climatic Change Vol. 29, p169-188.
Beeton R. J. S., Buckley K. I., Jones G. J., Morgan D., Reichelt R. E. & Trewin D. (2006 Australian State of the Environment Committee) 2006 Australia State of the Environment 2006 Independent report to the Australian Government Minister for the Environment and Heritage, Department of the Environment and Heritage, Canberra.
Bradstock R.A., Gill
A.M., Kenny B.J., and Scott J. 1998 Bushfire
risk at the urban interface estimated from historical weather records:
consequences for the use of prescribed fire in the Sydney region of
South-eastern Australia, Journal of Environmental Management, 52, pp
259-271
Bradstock
R, Williams JE and Gill AM, 2008 Effects of large fires on biodiversity in
south-eastern
Britton, N.R. (1986) An
appraisal of
Bureau of Transport Economics 2001 Economic costs of natural disasters in
Bureau of Meteorology, 2007, Fire Commonwealth of Australia, Accessed Online: http://www.bom.gov.au/climate/c20thc/fire.shtml 1-3-2007
Bureau of Meteorology, 2007a, High risk weather patterns -
http://www.bom.gov.au/inside/services_policy/fire_ag/bushfire/highnswq.html 14-6-2007
Bureau of Meteorology, 2007b,
Bureau of Meteorology, 2007c Fire weather
Bureau of Meteorology, 2007b,
http://www.bom.gov.au/climate/c20thc/storm.shtml 14-5-2007
Bureau of Meteorology 2007d Weather and
http://www.bom.gov.au/inside/services_policy/fire_ag/bushfire/wandfire.html 14-6-2007.
Bureau of Transport
Economics (BTE) 2001, Economic Costs of Natural
Disasters in Australia- Report 103, Australian Government
Bushfire Co-operative Research Centre (CRC) 2009, Victorian 2009 Bushfire Research Response
Final Report.
Centre for
International Economics (CIE) for Australian Building Codes Board, August 2010,
Consultation Regulatory Impact Statement:
Proposal to amend the Building Code of
Chambers, A. J. & Whitehead, J. H. 1992 Environmental Risk Analysis Board of Environmental Studies, Occasional Paper No. 16 March 1992, University of Newcastle, NSW.
Chen, K., 2005, ‘Counting
Bushfire-prone Addresses in the greater
Clode, D. (2010) A Future in Flames,
Council of Australian Governments (COAG) 2006 Council of Australian Governments’ Plan for
Collaborative Action on Climate Change Attachment C Council of Australian
Governments
Council of Australian Governments (COAG) 2007 The National Climate Change Adaptation Framework Australian
Government.
Cochrane, M.A., 2003 Fire science for rainforests Nature Vol. 421 p913-919.
Coffs Harbour Council, 2000 Fire Hazard Information Sheet, Coffs Harbour Council, Accessed online: http://www.coffsharbour.nsw.gov.au/resources/documents/Fire_Hazard.pdf. Accessed on January 2011.
Coleman, R. J. (1995) Structural wild land intermix USDA Forest Service General Technical Report PSW-GTR-158, p141-145.
Coleman, T., Hoegh-Guldberg, O., Karoly, D., Lowe, I.,
McMichael, T., Pearman, G., Scaife, P. & Reynolds, A. 2004 Climate Change Solutions for
Commonwealth of
Cova, T, 2005, Public safety in the urban-wildland interface: Should fire-prone communities have a maximum occupancy?, Natural Hazards Review, vol. 6, No. 3, pp. 99-108
CSIRO, 2006 Climate change impacts on fire weather CSIRO http://www.csiro.au/science/ps17j--vgnextfmt-print.html 18-3-2007.
CSIRO, 2007 Climate Change in the Sydney Metropolitan Catchments, prepared for the NSW Government by the CSIRO, www.greenhouse.nsw.gov.au.
Dunlop, C. 2004 Legal issues in emergency management: lessons from the last decade, Australian journal of emergency management Vol.19 p26-33.
Ellis, S., Kanowski, P. & Whelan, R. 2004. National Inquiry on Bushfire Mitigation and
Management, Commonwealth of
Emergency NSW, 30
July 2007, Major Storm Emergencies in NSW, available at
http://www.emergency.nsw.gov.au/content.php/273.html
Esplin B (
Gill, A., M. 2005 Landscape fires as social disasters: An overview of the bushfire problem’ Environmental Hazards Vol. 6, p65–80, Elsevier Ltd.
Garnaut, R. 2008, The
Garnaut Climate Change Review, Final Report,
Gergis, J.L., and
Fowler, A.M., 2006, How unusual was the
late 20th century El Niño-Southern Oscillation (ENSO)? Assessing
evidence from tree-ring, coral, ice-core and documentary palaeoarchives, A.D.
1525-2002, Advances in Geoscience, Vol. 6, pp. 173-179
GHD e-Newsletter Issue 4 December 2008, Accessed Online: http://www.ghd.com.au/Planning/Dec08/index.html
Granger,
K. Luxton, D. and Berechree, M, 2001 Natural
Hazards and the risks they post to
Gray v Minister for Planning & Ors [2006] NSWLEC 720;
Handmer, J. (2009) Australian Fire Policy May Emphasize ‘Go’ Over ‘Stay-and-Defend’ Natural Hazards Observer. 34(2): 15-17.
Handmer, J. 2010 Fire Prone Communities Resilient but not
Resistant, ECOS April – May 2010 CSIRO Publishing
Healey, D. T. 1985 Introduction The economics of bushfires: the South Australian experience Healey, D. T. & McKay, J. M. (eds) Oxford University Press, Melbourne.
Hennessy, K., Lucas, C.,
N. Nicholls, N. Bathols, J., Suppiah, R. & J. Ricketts, J. 2006 Climate
change impacts on fire-weather in south-east
Hennessy, K., B.
Fitzharris, B.C. Bates, N. Harvey, S.M. Howden, L. Hughes, J. Salinger and R.
Warrick, 2007: Australia and New Zealand.
Climate Change 2007: Impacts, Adaptation and Vulnerability. Contribution of the
Working Group II to the Forth Assessment Report of the Intergovernmental Panel
on Climate Change, M.L. Parry, O.F. Canziani, J.P. Palutikof, P.J. van der
Linden and C.E. Hanson, Eds., Cambridge University Press, Cambridge, UK,
507-540
Hennessy, K.,
McInnes, K., Abbs, D., Jones, R., Bathols, J., Suppiah, R., Ricketts, J.,
Rafter, T., Collins, D. and Jones, D. 2004, Climate Change in NSW. Part 2:
Projected changes in climate extremes.
Consultancy report for the New South Wales Greenhouse Office by the Climate
Impact Group of CSIRO Atmosphere Research and the National Climate Centre of
the Australian Government Bureau of Meteorology.
Hogenboom, J., Mol, A. P. J. & Spaargaren, G. 2000 Dealing
with Risk in Reflective Modernity from Risk in the Modern Age Cohen, M. J.
(ed) Macmillan Press LTD,
Hornsby and Ku-ring-gai Councils 2010 Bushfire Risk Management Plan
International Forest Fire News 2002 Fire Situation in Australia IFFN No. 26 - January 2002, p2-8 http://www.fire.uni-freiburg.de/iffn/country/au/au_8.htm 13-5-2007.
IPCC, 2001a, Climate
Change 2001: Synthesis Report. Contribution of Working Groups I, II and II to
the Third Assessment Report of the Intergovernmental Panel on Climate Change,
IPCC, 2001b, Insurance and Other Financial Services Climate Change 2001: Working Group II: Impacts, Adaptation and Vulnerability, Accessed Online: http://www.grida.no/climate/ipcc_tar/wg2/321.htm 15-3-2007
IPCC 2007a The Fourth Assessment Report of the United Nations Intergovernmental Panel on Climate Change, Intergovernmental Panel on Climate Change.
IPCC, 2007b, Summary for Policymakers Working Group-Contribution to the Intergovernmental Panel on Climate Change Fourth Assessment Report, Intergovernmental Panel on Climate Change 2007, Accessed Online: http://www.ipcc.ch/WG1_SPM_17Apr07.pdf 16-3-2007
IPCC, 2007c, Summary for Policymakers Working Group II Contribution to the Intergovernmental Panel on Climate Change Fourth Assessment Report Climate Change 2007: Climate Change Impacts, Adaptation and Vulnerability, Intergovernmental Panel on Climate Change 2007, Accessed Online: http://www.ipcc.ch/SPM6avr07.pdf 11-4-2007
Integrated Sustainability Analysis, Information Sheet 7 N.D
The Triple Bottom Line University of
Jones, R. N. &
http://www.csiro.au/files/files/pb9u.pdf 22-4-2007.
Kanowski, P.J. Whelan, R.J. Ellis, S. 2005 Inquiries following the 2002-2003 Australian bushfires: common themes and future directions for Australian bushfire mitigation and management, Australian Forestry. 68(2): 76-86.
Kershaw, A.P . 1986 Climatic change and aboriginal burning during the last glacial/interglacial cycles. Nature 322, p47–49.
Kiter-Edwards, M. L. 1998 An Interdisciplinary Perspective on Disasters and Stress: The Promise of an Ecological Framework Sociological Forum Vol. 13, No. 1. p115-132.
Ku-ring-gai Council, 2006a, Comprehensive state of the environment report, Ku-ring-gai Council Report, Available Online: http://www.kmc.nsw.gov.au/resources/documents/Council_SoE2004_[1].pdf28-3-2007
Ku-ring-gai Council, 2006b, Ku-ring-gai Biodiversity Strategy, Ku-ring-gai Council Report, Available Online: http://www.kmc.nsw.gov.au/resources/documents/Biodiversity_Strategy_May_2006_final_for_adoption1.pdf 27-4-2007
Ku-ring-gai Council, 2007a, About Council, Ku-ring-gai Council Publication, Available Online: http://www.kmc.nsw.gov.au/www/html/1170-about-council.asp 16-5-2007
Ku-ring-gai Council, 2007b, Amended Bushfire Management Policy 2007, Ku-ring-gai Council Report, Available Online:
http://www.kmc.nsw.gov.au/resources/documents/rptomc8May2007GB.03.pdf 17-6-2007
Ku-ring-gai Council, 2007c, Climate Change Mitigation and Adaptation Discussion Paper, Ku-ring-gai Council Publication, Available Online:
www.kmc.nsw.gov.au/resources/documents/Climate_change.pdf
Ku-ring-gai Council, 2007d, Community Profile Online, Available Online:
http://www.id.com.au/kuringgai/commprofile/default.asp?id=236&gid=10&pg=3 16-5-2007
Ku-ring-gai Council, 2007e Natural Environment, Ku-ring-gai Council Report, Available Online:
http://www.kmc.nsw.gov.au/www/html/63-natural-environment.asp 27-4-2007
Ku-ring-gai Council, 2007f, Sustainability Plan for Ku-ring-gai, Ku-ring-gai Council Report, Available Online: http://www.kmc.nsw.gov.au/www/html/198-sustainability-plan-for-ku-ring-gai.asp 21-5-2007
Ku-ring-gai Council, 2009a, Mapping and assessment of key vegetation communities across the Ku-ring-gai local government area, Volume 1 – Technical Report, Ku-ring-gai Council Report 2009.
Ku-ring-gai Council, 2009b, Acquisition and Divestment of Land Policy, Ku-ring-gai Council Report, Available Online: http://www.kmc.nsw.gov.au/resources/documents/rptomc8Sept2009GB.06.pdf
Ku-ring-gai Council, 2010a, Climate Change Adaptation Strategy, Ku-ring-gai Council.
Ku-ring-gai Council, 2011, Draft Biodiversity and Riparian Zones Study , Ku-ring-gai Council
Lavorel, S. & Steffen, W. 2004 Cascading impacts of land use through time: the Canberra bushfire disaster In Steffen, W., Sanderson, A., Tyson, P., Jäger, J., Matson, P., Moore III, B., Oldfield, F., Richardson, K., Schellnhuber, H-J., Turner II, B. L. & Wasson, R. Global Change and the Earth System: A Planet Under Pressure IGBP Global Change Series, Springer-Verlag, Berlin Heidelburg New York..
Lawson-Hanscombe, P. 1991 The Storm Ku-ring-gai Municipal Council & Playbill Proprietary LTD, Pymble, NSW.
Leonard J.E et al 2004 On the Development of a Risk-Model for Bushfire Attack on Housing
Lucas, C., Hennessy,
K., Mills, G., and Bathols, J., 2007, Bushfire
weather in southeast
Lucas, C., 2005, Fire Weather History of
Matthews, K. (Chairperson) 2002 Natural Disasters in
McCarthy, J. J., Canziani, O. F., Learty, N. A., Dokken, D.
J. & White, K. S., (eds.) 2001 Climate
Change 2001: Impacts, Adaptation, and Vulnerability Intergovernmental Panel
on Climate Change, Geneva.
Morrison, D. A., Gary, G. J., Pengelly, S. M., Ross, D. G.,
Mullins, B. J., Thomas, C. R. and Anderson, T. S. 1995. Effects of fire frequency on plant species composition of sandstone
communities in the
http://onlinelibrary.wiley.com/doi/10.1111/j.1442-9993.1995.tb00535.x/abstract
Meyer, M., Galbally, I. Cook, G. Barrett, D. Tolhurst, K. & Graetz, D. 2001 A spatially explicit inventory of trace gas emissions from wildfires and controlled burning over Australia Abstract, Cape Grim Baseline Air Pollution Station, Annual Scientific Meeting, 6-7 Feb 2002 p29, Hobart, Tasmania.
Max A. Moritz & Scott L. Stephens, Published online: 24 November 2007, Fire and sustainability: considerations for
http://www.nma.gov.au/shared/libraries/attachments/schools/resources/fire_in_australia/fire_in_australia_black_and_white/files/8292/fire_bw.pdf 13-5-2007
Newell, R. & Pizer, W. 2001 Discounting the benefits of climate change mitigation Prepared for
the Pew Centre on Global Climate Change,
NSW Department of Environment and Conservation NSW 2006 Who Cares about the Environment in 2006 Government of NSW
http://www.environment.nsw.gov.au/whocares/whocares2006.htm 14-5-2006
NSW Department of Environment, Climate Change and Water,
October 2007, Guidelines for the
management of
NSW Department of Environment, Climate Change and Water, 2008, NSW Climate Change Action Plan 2008- viewed November 2008: Available Online: www.environment.nsw.gov.au/resources/climatechange/
NSW Department of Environment Climate Change and Water, 2008a, Rapid Fauna Habitat Assessment of the Sydney
Metropolitan Catchment Management Authority Area, 2008
NSW Department of Environment, Climate Change and Water, June
2010 NSW Climate Impact Profile - impacts
of climate change on the biophysical environment of
NSW Department of Planning 2005 Metropolitan Strategy - City of Cities: A
Plan for Sydney’s Future NSW
Government
NSW Department of Planning 2007 North Subregion Draft Subregional
Strategy NSW Government
NSW Department of Planning, 2009 LEP Practice Note PN 09-002 Environment Protection Zones, 30 April 2009
NSW Department of Planning, 2010 LEP Practice Note PN 10-001 Zoning for Infrastructure in LEPs, 14
December 2010
NSW Fire Brigade 2003 Ignition Factor by Local Government Area NSW Fire Brigade
http://www.nswfb.nsw.gov.au/education/publications/stats/0203/files/Table10.pdf 16-6-2007.
NSW Government, 1997 Local Government Amendment (Ecologically Sustainable Development) Act 1997
NSW Government 1993 Local Government Act 1993 NSW
Government
NSW Government, 2002 Civil Liability Act 2002
NSW Government,
2010 NSW Government Response to the Final Recommendations of the 2009 Victorian
Bushfires Royal Commission
NSW
Government, 2010a Draft NSW Biodiversity
Strategy Prepared by the Department of Environment, Climate Change and
Water NSW and Industry and Investment NSW
NSW
Government, 2010b Metropolitan Plan for
NSW
Government 2010c
NSW Rural
Fire Service, 1994, Department of Bush Fire Services Annual
Report- 1993-94, NSW Government
NSW Rural Fire Service 1998 A State Ablaze: The January 1994 Fires NSW Rural Fire Service, Rosehill, NSW.
NSW Rural Fire Service, 2006 Planning for Bushfire Protection, NSW Rural Fire Service.
NSW Rural Fire Service,
February 2006 Bushfire Environmental
Assessment Code for
NSW Rural Fire
Service, 2007, NSW Rural Fire Service
2006-2007 Annual Report, NSW Government.
NSW Rural Fire
Service, 2008, Brief History of Bush
Fires in NSW,
http://www.rfs.nsw.gov.au/dsp_content.cfm?cat_id=1180&pff=1
(accessed 05/09/2008)
NSW Rural Fire Service, 2010 Planning for Bushfire Protection Addendum: Appendix 3, NSW Rural
Fire Service.
NSW
Rural Fire Service, 2011, Neighbourhood
Safer Places, http://www.rfs.nsw.gov.au/dsp_content.cfm?cat_id=1785
(accessed 16/11/2010)
O’Bryan D, 2005 The
science of bushfire behaviour: the search for answers,
Paix, B. 1999 Improving
burnover protection for Australian bushfire appliances In: Bushfire’99
Proceedings p307-319.
Pearce, G., Mullan, A.B., Salinger, M.J., Opperman, T.W., Woods, D. & Moore, J.R. 2005 Impact of climate variability and change on long-term fire danger Report to the New Zealand Fire Service Commission, p75.
Peel, Jacqueline (2007). The
role of climate change litigation in
Pitman, A. J.,
Narisma, G. T., and McAneney, J., (2007), The
impact of climate change on the risk of forest and grassland fires in Australia,
Climate Change, (2007), 87, pp. 383-401
Pittock, B. (ed) 2003 Climate Change: An Australian Guide to the Science and Potential Impacts Australian Greenhouse Office, Commonwealth of Australia.
Pittock, B. (ed) 2003 Climate Change: An Australian Guide to the Science and Potential Impacts Australian Greenhouse Office, Commonwealth of Australia.
Schneider, S. & Lane, J. 2005 Integrated assessment modelling of global climate change: much has been learned—still a long and bumpy road ahead Integrated Assessment Vol.5 p41–75.
Scott, J.,
Scott
Mills L, Soulé M. E and Doak D. F, 1993, The
Keystone-Species Concept in Ecology and Conservation, BioScience
Journal, Vol. 43, No. 4,
pp. 219-224, University of California Press, Available Online: http://www.jstor.org/stable/1312122
SGS Economics and Planning, 2008 Ku-ring-gai and Hornsby Subregional Employment Study Final Report
Smith, M. A.,
Jalaludin, B., Byles, J. E., Lim, L., & Leeder, S. R., 1996, Asthma Presentations to Emergency
Departments in Western Sydney during the January 1994 Bushfires, International
Journal of Epidemiology, Vol. 25, No. 6, 1996
Standards Australia 2009 AS 3959-2009 Construction of buildings in bushfire prone areas, Standards Australia.
Stern, N. (2006) The Economics of Climate Change, H.M
Treasury,
Sturnam, A. Tapper, N. (2005). The Weather and Climate of
Sydney Morning Herald 5-8-2003
Sydney Morning Herald (11-4-2007) Koalas may be extinct in seven years, Sydney Morning Herald, FairfaxDigital http://www.smh.com.au/news/environment/koalas-may-be-extinct-in-seven-years/2007/04/11/1175971155875.html 11-4-2007
Taplin, R. Henderson-Sellers, A, Trueck, S. Mathew, S Weng, H. Street, M. Bradford, W. Scott, J. Davies, P. and Hayward, L. (February 2010) Economic Evaluation of Climate change Adaptation Strategies for Local Government: Ku-ring-gai Council Case Study Bond University, Macquarie University, Ku-ring-gai Council.
Thomson, N. 1985 The South Australian bushfire cost to Government The economics of bushfires: the South Australian experience Healey, D. T. & McKay, J. M. (eds) Oxford University Press, Melbourne.
Underwood R. et al 2008 Bushfires,
Prescribed Burning and Global Warming
US Environmental Protection Agency 2007 Terms of Environment: Glossary, Abbreviations and Acronyms
Victorian Bushfires Royal Commission 2009a Interim Report, 2009 Victorian Bushfires
Royal Commission, Parliament of
Victorian Bushfires Royal Commission 2009b Interim Report 2- Priorities for building in bushfire prone areas, 2009 Victorian Bushfires Royal Commission, Parliament of Victoria.
Victorian Bushfires Royal Commission 2010 Final Report, 2009 Victorian Bushfires Royal Commission,
Parliament of
Wang, H. 2006, Life in
a fire prone Environment: Translating
science into practice, Bushfire conference 2006,
Watson, P. and Morris, C., (2006), Effects of fire on vegetation in Western Sydney’s grassy Cumberland plain woodland and implications for management, Bushfire Conference 2006, 6-9 June 2006: life in a fire-prone environment: Translating science into practice
Webb, R., Davis, C.
J., and Lellyett, S., 2003, Meteorological
Aspects of the ACT Bushfires of January 2003, Bureau of Meteorology,
Wettenhall, R. L. 1975 Bushfire disaster: An Australian Community in Crisis Angus & Robertson, Sydney.
Williams, A. A. J., Karoly, D. J. & Tapper, N. 2001 The Sensitivity of Australian Fire Danger to Climate Change Climate Change Vol. 49, p171-191, Kluwer Academic Publishers.
Williams, A. A. J. & Karoly, D. J. 1999 Extreme Fire Weather in
Willis, M. 2005 Bushfires-How can we avoid the unavoidable? Environmental Hazards Vol. 6, p93-99, Elsevier Ltd.
Wolshon, B Hicks Meehan, B 2003 Emergency Evacuation – Ensuring Safe and Efficient Transportation out of Endangered Areas, TR News 224.
Zhenxiang Tan et al, 2006 Bushfire Risk Register – A Tool for Bushfire Risk Management Planning, presented to Bushfire Conference Brisbane 2006.
|
APPENDIX No: 2 - Managing bushfire risks now and into the future |
|
Item No: GB.2 |
Appendix A
Review of current zoning in
bushfire risk areas
Table A1 Current zoning
in bushfire prone lands and bushfire risk evacuation zones
|
Area |
Bushfire prone lands Category
1 |
Bushfire prone lands category
2 |
Bushfire prone lands buffer |
Bushfire risk evacuation
zones |
|
LGA generally |
The vast majority of lands within this
bushfire category are open space or National Park. However, there are
scattered private sites within this category. Mostly these are parts of low
density residential sites, but also includes some larger sites within most
suburbs · 2(c), which has a minimum lot size of 929m2,
including some large lots (up to a hectare in Pymble); · 2(b), which has a minimum lot size of 836 m2
(including 3 hectares -part of Bushranger Reserve- and 2.7 ha of crown land
in East Killara) · 2(a), which has a minimum lot size of 790m2,
including large lots (eg up to 1.6 ha in Roseville Chase). |
Not
very common in LGA Generally
Open space land -6(a), sometimes also affecting adjoining low density residential |
Most of the lands within this bushfire
category are low density residential sites · 2(c), which has a minimum lot size of 929m2,
· 2(b), which has a minimum lot size of 836 m2; · 2(a), which has a minimum lot size of 790m2. |
Mostly
zoned for low density development, and some of the other land uses in
Categories 1,2 and the buffer. It
also includes 5 neighbourhood centres as specified below. |
|
Other zoning and land size by suburbs |
||||
|
Wahroonga |
· SAN: E2 – Environment conservation, R2 – Low density
residential · Proposed county road (abandoned) · Special uses (WS&D) · Special uses – school · Special uses
(WS&D) (MLALC) |
· 2(c) sites |
· SAN: SP1 Health Services Facilities, B1 –
Neighbourhood centre, R1-, R2, R3, R4
Residential · Proposed county road (abandoned) · Special uses (WS&D) · Special uses - school |
· Fox Valley Neighbourhood Centre · Neighbourhood centre |
|
Turramurra |
Turramurra town centre: · E2- Environment conservation |
· 2(c) site |
Turramurra town centre: · E4 –Environmental Living · B2 – Local Centre · R4 High density residential · 2 x Special uses – Church · Business - retail – (3A-A3) |
|
|
|
Includes
some larger 2(c) lots, Special uses, and Residential 2(g) lots with a minimum
lot size of approximately 1 hectare. |
|
· Special uses (Seniors living, school, hospital) · Residential 2(g) which currently have a minimum lot
size of approximately 1 hectare · One residential 2(h) site which permits residential
flat buildings and other more intense development on lots of at least 650m2 · 3(a) – A3 – Business retail services – the rear of
shops in the North Turramurra neighbourhood centre. |
· Neighbourhood Centre |
|
St Ives |
· A portion of a large R3- Medium density residential
land in the town centre · Special uses –Schools · Special uses – Municipal Purposes (Driver training
side of Mona Vale Rd) · 6(a) zone -St Ives Showground St Ives Chase: · Also affects a few larger 2(c) lots |
· Special Uses -Substation St Ives Chase: · 2 x 2(c)sites |
· Including a large scale Seniors development · A school (on 2(c)
land) · Special uses –Schools, substation, Municipal
purposes (community centre), Sydney Water · Proposed county road (now abandoned) · Some R3 land in the town centre · Special uses – Municipal Purposes (Driver training
side of Mona Vale Rd) · 6(a) zone -St Ives Showground St Ives Chase: · Includes a school |
|
|
Pymble |
In the town centre · R2 lands including a school · SP1- Military uses Outside the town centre · 6(b) private recreation (Golf course) |
· 2(c) sites |
In the town centre · R2 lands including a school · B7 – business park · SP1- Military uses · Some R3 land · Some R4 – high density residential sites Outside the town centre · 6(b) private recreation (Golf course) · Special uses – school, municipal (Bicentennial park) |
|
|
Lindfield |
· Part of UTS site zoned under SEPP (Major development)
– mostly E1 and E3. · Special uses – Commonwealth purposes (film school
& CSIRO) · IDO 29 –Naamaroo Conference Centre |
· Special use zone – school |
· Part of UTS site zoned under SEPP (Major
development) – mostly residential, business and open space; · Special uses – Commonwealth purposes (film school
& CSIRO) · IDO 29 –Naamaroo Conference Centre · Special use zone -school · Special use zone – school · Within the 2(a) zone, a bowling club, and a large
scale retirement village |
· Neighbourhood Centre |
|
Gordon |
|
|
· Residential 2h (St John’s Wood) · R2 and R4 sites |
|
|
Killara |
|
|
Killara · 2 x Special uses – School · Major seniors living development · Minor incursion into 3a commercial land |
Neighbourhood
centre |
|
|
· E4 sites |
|
· Special uses –Sydney Water · E4 sites |
|
|
APPENDIX No: 2 - Managing bushfire risks now and into the future |
|
Item No: GB.2 |
Appendix B
Vulnerability of existing
development
Figure B1 Cowan Catchment example of ‘ideal’ setback for Asset Protection Zone
|
APPENDIX
No:
2 - Managing
bushfire risks now and into the future |
|
Item
No:
GB.2 |
Figure B2. Middle Harbour Catchment example of ‘ideal’ setback for Asset Protection Zone
|
APPENDIX
No:
2 - Managing
bushfire risks now and into the future |
|
Item
No:
GB.2 |
Figure B3.
|
APPENDIX
No:
2 - Managing
bushfire risks now and into the future |
|
Item
No:
GB.2 |
Proximity of Ku-ring-gai’s
Older Population to bushfire hazard
Figure C1 Percentage of Ku-ring-gai
population 75 years and over in relation to
(Vegetation that forms the bushfire hazard)
|
APPENDIX
No:
2 - Managing
bushfire risks now and into the future |
|
Item
No:
GB.2 |
Figure
C2 Percentage of Ku-ring-gai population 60 to 75 years and over in relation to
(Vegetation that
forms the bushfire hazard)
|
APPENDIX No: 2 - Managing bushfire risks now and into the future |
|
Item No: GB.2 |
Appendix D
Review of exits from
Evacuation Risk Areas
Table D1 Ku-ring-gai’s
Evacuation Risk Areas, assessed using Cova (2005)
Minimum
number of exits per household
|
Evacuation risk area |
Key road/s |
No of exits |
No of dwellings |
Recommended max no of dwellings* |
Number over recommended |
||
|
Number |
|||||||
|
1 |
|
1 |
403 |
50 |
|
|
353 |
|
2 |
Bobbin |
1
to 2 |
947 |
50 |
to |
300 |
897 |
|
2a |
|
1 |
39 |
50 |
|
|
-11 |
|
2b |
|
1 |
15 |
50 |
|
|
-35 |
|
3 |
|
2 |
510 |
300 |
|
|
210 |
|
3a |
|
1 |
16 |
50 |
|
|
-34 |
|
4 |
|
1 |
32 |
50 |
to |
300 |
-18 |
|
5 |
Eastern |
1 |
285 |
50 |
|
|
235 |
|
5a |
Woodvale Cl |
1 |
6 |
50 |
|
|
-44 |
|
6 |
|
2
to 3 |
613 |
300 |
to |
600 |
313 |
|
7 |
|
1 |
21 |
50 |
|
|
-29 |
|
8 |
|
4 |
683 |
N/A |
|
|
|
|
9 |
|
2 |
105 |
300 |
|
|
-195 |
|
10 |
Parker |
1 |
96 |
50 |
|
|
46 |
|
11 |
Ravenhill Rd/CarinaRd |
2 |
148 |
300 |
|
|
-152 |
|
12 |
|
4 |
628 |
N/A |
|
|
|
|
13 |
|
1 |
62 |
50 |
|
|
12 |
|
14 |
Browns |
1
to 2 |
396 |
50 |
to |
300 |
346 |
|
14b |
San hospital and surrounds |
N/A |
Not assessed |
|
|
|
|
|
14a |
|
1 |
66 |
50 |
|
|
16 |
|
15 |
Mitchell Cr |
2 |
57 |
300 |
|
|
-243 |
|
15a |
|
1
to 2 |
82 |
50 |
to |
300 |
32 |
|
Total |
|
5210 |
|
|
Based
on bottom of range |
||
Determining a minimum lot depth
Planning for Bushfire
Protection 2006 provides
for setbacks from residential development to the bushfire hazard. For infill
development it is recognised that these setbacks cannot always be achieved, but
the available setback is nevertheless required to be managed as an Asset
Protection Zone. Where subdivision is proposed, it is reasonable that this
setback be met, and accordingly lot depths need to be sufficient to accommodate
these setbacks.
Table E1 is an excerpt from Table A2.4 Minimum Specifications for Asset
Protection Zones (m) for Residential and Rural Residential Subdivision Purposes
(for Class 1 and 2 buildings) in FD_ 100 Fire Areas (<29kW/m2) in PBP.
Table E1 Minimum Specifications for Asset Protection Zones (m)
|
Effective Slopes |
|||||
|
Vegetation Formation |
Upslope /Flat |
>0o
-5 o |
>5 o
-10 o |
>10 o
-15 o |
>15 o -18 o |
|
Rain- forests |
10 |
10 |
15 |
20 |
25 |
|
Forests |
20 |
25 |
35 |
50 |
60 |
|
Tall
heath (Scrub) |
15 |
15 |
20 |
20 |
20 |
|
Short
heath (Open Scrub) |
10 |
10 |
10 |
15 |
15 |
|
Freshwater
Wetlands |
10 |
10 |
10 |
15 |
15 |
|
Forested
Wetlands |
15 |
20 |
25 |
35 |
45 |
In Ku-ring-gai, almost all vegetation at the
urban/bushland interface is classified as forest, for the purposes of Planning for
Bushfire Protection 2006. From table E1 the following are the
recommended APZ setbacks for residential and rural residential subdivision
(class 1 and 2 buildings) under PBP for forests in Ku-ring-gai:
A sample of lots adjoining bushland was
reviewed. Lots of less depth (eg less than 40m) consistently had dwellings
built very close to the hazard. Lots which have their side to the bush are also
extremely close to the hazard. Even lots where there is a road between the
bushland and the front boundary, have dwellings that are closer to the hazard
than the desirable APZ. Deeper lots, unsurprisingly, generally had deeper rear
yards and setbacks to the bushland. Nevertheless, these setbacks still do not
meet the setbacks for an Asset Protection Zone (APZ) identified under Planning for Bushfire Protection 2006,
as shown in Appendix 3.
Front setbacks were commonly a minimum of 9m or 12m (consistent with
Council’s planning controls), while dwelling depths were often from 14m to 20m.
House and front yard therefore totalled from 23m to 32m depth. [10]
Given likely increases in frequency and intensity of fires a
conservative approach has been taken and the higher APZ setback used for each
group of slopes in the scenarios below.
· Using a standard setback to the rear of the
dwelling of 25m for slopes from flat to 5 o would result in a lot
depth to the hazard ranging from 48 to 57m.
· Using a standard setback to the rear of the
dwelling of 35m for slopes from greater than 5 o to 10 o
would result in lot depths from the hazard ranging from 58 to 67m.
· Using a standard setback to the rear of the
dwelling of 60m for slopes from greater than 10o to 18o
would result in lot depths from the hazard ranging from 83 to 92m.
It is noted that some effective slopes are greater than 18 o
and no standards have been set for APZs for such sites.
Minimum lot depths
from the hazard are recommended as in Table x below.
Table E2 Recommended
Minimum
|
Upslope/flat
- 5 o |
>5 o - 10
o |
>10 o |
|
55m |
65m |
90m |
The minimum
lot depth would be calculated from Category 1 and 2 vegetation, as identified
on the Bushfire Prone Lands Map. This
would allow for changes to the line of the hazard, with the regular updates to
the Bushfire Prone Lands Map, without
the need to amend the LEP.
[1] Length of bushland interface
has been calculated as that between private housing areas and Council bushland
reserves. The length of bushland between developed areas and bushland of all
tenures is 160km.
[2] Over 400 people have lost
their lives in bushfire events over the last 53 years (Blanchi et al, 2010, in
CIE, 2010)
[3] The full list also includes: hot days and nights; hail
and thunderstorms; cold days and nights; tropical cyclones; heavy rainfall
events; bushfires; droughts; extreme winds; and floods.
[4] For the purposes of SEPP
(Housing for Seniors or People with a Disability) 2004 and SEPP 53 –
Metropolitan Residential Development
[5] These grants are the
Bushfire Mitigation Programme, the Fire Mitigation Works Fund and the Rural
Fire Fighting Fund.
[6] Note that for the purposes of
further assessment within this report, these 12 areas are split into 22 areas
as shown in figure 16.
[7] Through SEPP (Housing
for Seniors and People with a Disability) 2004, and SEPP 53 – Metropolitan
Residential Development
[8] In the largest sample
area over 20% of the houses more than 100m from forest were destroyed.
[9] This does not take into account the redevelopment of the Seventh Day Adventist site in Wahroonga as approved under Part 3A of the EP&A Act.
[10] Two other council areas
were found to have used minimum lot depths in this way, estimating the required
dwelling and yard as 30-35m deep. Eg.